
We’ve added our predictive TRACR model as another tool for analyzing FCS football teams. The outputs include team ratings and predictions, along with each team’s projected record and probability of winning out. Here’s how the computer element adds to the human element in Opta Analyst’s FCS coverage.
Get set to be the most-informed FCS football fan in the stadium.
Beginning with the 2024 season, we’re going to help you evaluate and rank FCS teams with even more accuracy – combining past results with a look into what should be happening next.
Opta Analyst is introducing to FCS football its all-encompassing metric that weighs every team based on its true talent called TRACR (Team Rating Adjusted for Competition and Roster). This net efficiency metric, which we pronounce tracer and not tracker, considers how good a team is at every play relative to the strength of its opponent. The accumulation provides an offensive rating and a defensive rating, and the difference between them gives an overall team rating.
By using TRACR along side the evaluations of the Stats Perform FCS Top 25 Poll, the national landscape can be considered at a new layer of depth with a computer element that takes into account every relevant data point. It’s meant to complement the human variables analyzed by the poll’s expert voters. To be clear, the two remain separate – TRACR does not impact the longstanding poll and isn’t given a vote.
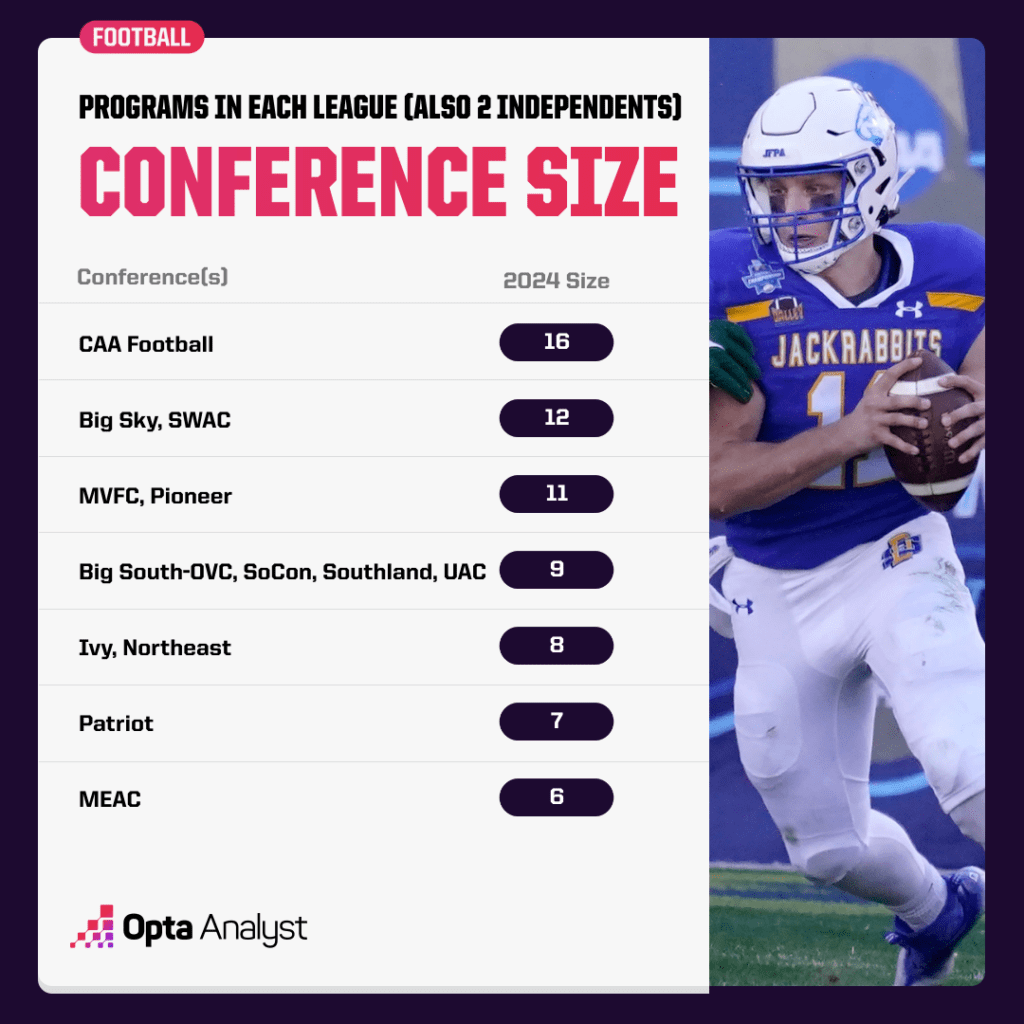
So what’s the difference between the two FCS football methods? Well, what’s great about the FCS Top 25 Poll is it allows a group of national media members representing all 13 conferences to contribute to a ranking system that’s based on what has already happened. Their voting is based on tangible results and observations from the current season.
But perhaps the best predictor of what will happen for the rest of the season is reserved for data science and AI models, which we already use to make projections in a number of sports, including FBS college football and the NFL (both models are trained on over 10 years of data).
TRACR is based on how good a team is offensively and defensively against an average team per 10 drives in a game. An average FCS team has a TRACR of 0.0, so a team with a positive TRACR indicates it would outscore an average team by that many points.
As an example, a team with an offense that is a point per drive better than the average team would have an offensive TRACR of 1×10=10. If that same team has a defense that is 0.5 points per drive lower than the average team, it would have a defensive TRACR of -0.5×10=-5 (on this side of the ball, the lower than 0 the better). The team’s overall TRACR would be 10-(-5)=15.
All of the information provides pre-game win probabilities between teams and thus calculates season projections.
The TRACR data-driven FCS team ratings and predictions, along with each team’s projected record and probability of winning out, will be updated throughout the season. In addition, the FCS Top 25 Poll is released each Monday during the regular season.
It’s a way to double up the knowledge in FCS football.
Follow all of our FCS football coverage, including on X, Facebook and Instagram.