
Predicting which teams will make deep playoff runs at the beginning of any NBA season can be a daunting endeavor. But this is especially the case this year when the league hierarchy projects to be as wide open as it has been since Michael Jordan first called it quits in 1993.
The NBA is so deep that new-look units like the Atlanta Hawks, Cleveland Cavaliers, and Minnesota Timberwolves aren’t even in the top 12 in odds to take home the title (according to most major gambling outlets).
With parity oozing through our ranks, it will require a sophisticated mechanism to weed out the contenders from all the noise.
Fortunately, we have just the tool.
Adjusted Offensive and Defensive Ratings
The first question to ask here is which types of teams reach the conference finals?
To understand this, we will need to look back at the offensive and defensive aptitude of past conference finalists. Using our unique adjusted offensive rating (AOR) and adjusted defensive rating (ADR) metrics, we can analyze these teams in the context of their specific eras.
On their own, raw numbers like offensive and defensive rating don’t offer much insight, as those variables fluctuate greatly due to the changes in style and pace that have occurred throughout the league over time.
However, our adjusted measurements account for these changes and isolate a certain team’s impact to tell us how many points per 100 possessions better or worse teams were compared to the league-average club during that season, including the playoffs.
Since our data tracks back to the 1986-87 campaign, we have a sample size of 144 conference finals teams to help guide our analysis.
These 144 data points can be condensed into four specific team constructs: balanced teams, elite offenses, elite defenses and a group we’ll simply label “other” for now.
Balanced Teams
For this exercise, a ‘balanced’ team is defined as one that posted an AOR of 1.5 or higher and an ADR of minus-1.5 or lower.
This group was by far and away the most prominent team category among conference finalists, with ‘balanced’ teams making up 64 of our 144 (roughly 44.4%) conference finalists.
This frequency indicates that this roster configuration is likely the easiest to attain. This makes sense from a team-building perspective since you don’t need to worry about striking gold on offensive juggernauts like Steve Nash or defensive stalwarts like Dwight Howard.
You need only focus on finding pieces that counterbalance each other’s strengths and weaknesses.
A great example of this is the 1986-87 Detroit Pistons. The group was not what we identify as elite on either side of the ball (3.08 AOR and minus-1.9 ADR). But they reached the conference finals on the backs of skilled guards like Isiah Thomas, Joe Dumars and Vinnie Johnson, and versatile bigs like Bill Laimbeer, Rick Mahorn and John Salley.
It’s also worth mentioning that the teams that fit the criteria for ‘balanced’ and elite offense/defense were placed in this category for the sake of simplicity.
Elite Offense
Forty-six of the 144 teams (31.9%) fit our guidelines for an elite offense: an AOR of 3.5 or higher with an ADR greater than minus-1.5.
These teams generally lacked superstar defensive personnel but made up for it with their all-time offensive engines on the other end.
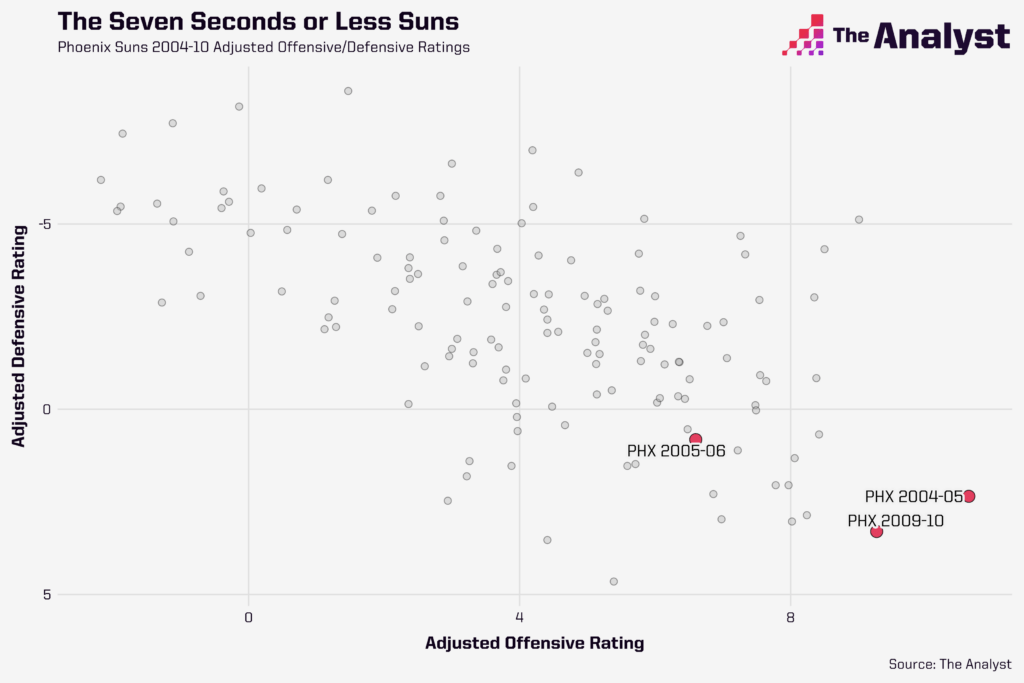
The aforementioned Steve Nash and his Seven Seconds or Less Phoenix Suns are the epitome of this model. From 2005-10, the group made three conference finals despite never once touting a league-average defense or better (according to ADR).
Elite Defense
It looks like defense doesn’t necessarily win championships, as this section was only the third-most common subcategory of the four outlined for this study. To fit here, a team had to have a minus-3.5 ADR or lower and an AOR lower than 1.5.
Marginal offenses that rely on defenses to captain the ship typically boast elite-level rim protectors. Some examples of these goliaths include Howard, Patrick Ewing, David Robinson, Tim Duncan, Alonzo Mourning, Ben Wallace, Joakim Noah and the Gasol brothers.
This makes sense considering that the paint is the most valuable area on the floor and that the teams that protect it the best often have the most success.
Others
Up to this point, we’ve established that teams that make deep playoff runs generally have either elite offenses, elite defenses, or sport a great deal of balance on both sides of the ball. Still, there were 14 teams (9.7%) that did not fit any of these descriptions.
Most of these outliers (eight of 14) can be explained by examining the strength of their conference.
For instance, during the early 2000s, there was a large talent disparity between the Eastern and Western Conferences. The 2000-01 Philadelphia 76ers may have been the Eastern Conference champions, but they only ranked seventh in our adjusted team ratings that season behind six Western Conference teams (the San Antonio Spurs, Los Angeles Lakers, Sacramento Kings, Utah Jazz, Dallas Mavericks and Portland Trail Blazers).
Three more of these teams – the 2003-04 Lakers, 2020-21 Hawks, and 2021-22 Heat – just barely missed the cutoff line for some of our subcategories. Both the Hawks and the Heat would fit the definition for “elite offense” if we simply changed the threshold from 3.5 or higher to 3.25 or higher (the downside of creating arbitrary guidelines).
The final three teams – the 1988-89 Chicago Bulls, 2014-15 Houston Rockets and 2021-22 Dallas Mavericks – are a bit more difficult to address.
These three teams represent aberrations in timeline. All three of these were underdogs that defied the odds to vanquish a higher-seeded opponent (the Bulls), comeback from a seemingly insurmountable series deficit (the Rockets), or both (the Mavericks).
These anomalies represent the human aspect of sports, and since they only account for 2.1% of our conference finalists, they won’t factor too heavily in our analysis.
Projecting into 2022-23
Increased player autonomy has coincided with an uptick in league wide player movement from year to year. This social change comes with many benefits (which are outside the scope of this study), but for our purposes, it makes projecting this year’s conference finals slate an arduous task.
Still, our survey of the past portends to be incredibly meaningful once we get a legitimate grasp of each team’s offense and defense. As our data compository on each of the 30 NBA teams increases, look for us to revisit this study at multiple points throughout the season to pinpoint potential contenders. From there, we can start to predict which teams might fit in the subcategories we have created and outlined.
And that’s why we lean on data in the first place, to help us paint a clearer picture.
Enjoy this? Subscribe to our newsletter to receive five stories each Friday. It’s free