
On June 12, 1991, a dynasty was born when the Bulls closed out Magic Johnson and the Lakers in Game 5 of the NBA Finals. Thirty years later, we’re using a 1986-87 to 2019-20 team rating model to place those Bulls teams in a better historical context compared to their immediate predecessors, contemporaries, and descendants.
When we think back on great teams of the past, the feeling is one of inevitable victory because the words and images we associate with those teams leave little room for a retrospective sense of uncertainty.
Dynasty. Greatness. Dominance. Spectacle. There are only so many ways to state and remember it. Numbers are different. They at once last and evolve with the expanding historical context of the sport and give us ways to make the story new again with each season.
When it comes to NBA championships, it seems now with time and distance that the Chicago Bulls teams of the 1990s were always going to win. But the truth is only a few of those teams were so good that they were never going to lose. On June 12, 1991, the Bulls’ dynasty officially began.
We can’t remember what we couldn’t know, and what we couldn’t know is how those teams would hold up against history. Here, we’ve created a model using data on both sides of the ball to calculate how many points per 100 possessions better or worse championship teams from 1986-87 to 2019-20 were than the average team during those specific seasons, including the playoffs.
Made up of superstars, the ’90s Bulls were an NBA dream team a few times over. A kid from North Carolina became a perennial All-Star, an NBA champion, an icon, a brand and arguably the greatest of all time.
During the second three-peat alone, Michael Jordan provided remarkable performances like The Flu Game in Game 5 of the ’97 Finals, a 55-point effort in Game 2 of the ’97 first-round series against the Washington Bullets and the famous shot against the Utah Jazz that clinched Chicago’s sixth title in the last playoff appearance of his career.
We of course also remember the shots spanning both three-peats. There was Kerr vs. Utah in ’97, Paxson vs. the Phoenix Suns in ’93, and in one half in ’92: Jordan vs. Portland, Jordan vs. Portland, Jordan vs. Portland, Jordan vs. Portland, Jordan vs. Portland, and Jordan vs. Portland.
The Bulls went 203-43 (.825) during the regular season from 1995-96 to ’97-98. It was the best winning percentage by any team in a three-season span in NBA history before the Golden State Warriors went 207-39 (.841) from 2014-15 to ’16-17.
As part of it, on April 16, 1996, the Bulls’ 86-80 win at Milwaukee established an NBA record with No. 70 of their 72-win season. Had it become the best team of its generation? The best team ever? How does it compare to some of the best championship clubs in the more recent decades? It’s a fair question since seven teams have won at least 67 games since, including the 2015-16 Warriors who went 73-9 to break the Bulls’ record[1].
We’ll start with the 1986-87 season when Jordan played with an edge after missing all but 18 games of the previous year because of a broken foot. He averaged a career-high 37.1 points and put the Bulls on the cusp of a breakthrough. No one has averaged more points per game since. James Harden was the first to come within a point last season with 36.1, and Wilt Chamberlain’s ’62-63 season was the last to surpass it.
Here’s our list of the top 10 teams who took home the title from 1986-87 to 2019-20 based on their points per 100 possessions departure from the average team:
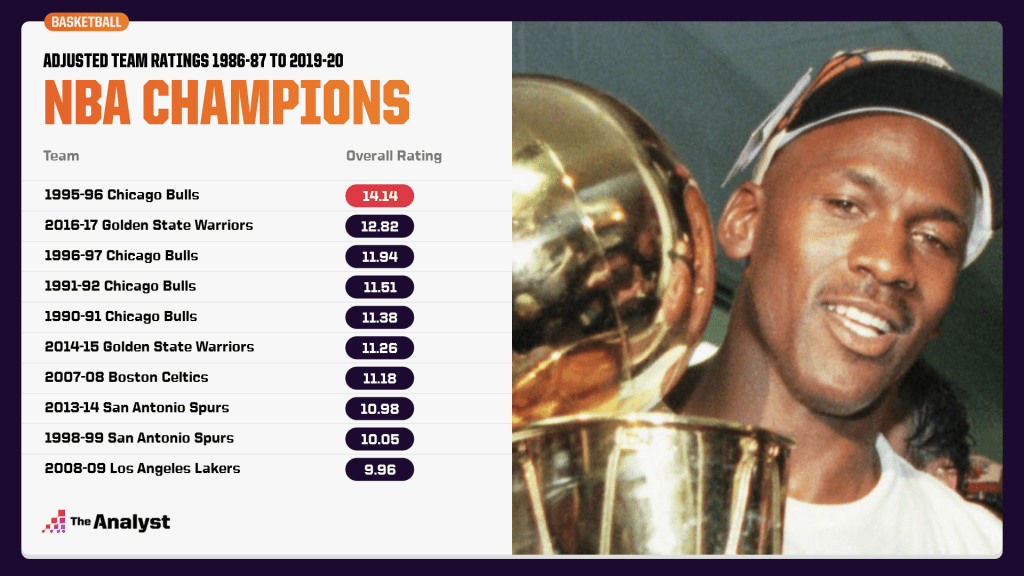
The 1.32 gap between the 1995-96 Bulls and the 2016-17 Warriors, Nos. 1 and 2 on the list, is greater than the gap between all other neighboring positions on the list, and it’s greater than the gap between Nos. 2 and 4. For the sake of comparison with the regular-season record-setting Warriors, that 73-win team’s rating was 10.48, though it’s not included on this list because it didn’t win the title.
In case you’re wondering, last year’s Lakers finished with a 7.02 adjusted team rating.
The team-rating gap in ’95-96 between the Bulls (14.14) and next-best Utah (9.02) is greater than the gap between Utah and the sixth-ranked Lakers (4.32). That season, Jordan became the oldest player in league history to average 30-plus points with 30.4. At 32 years and 349 days old, he was more than a year older than Jerry West, who averaged 31.2 points at 31 years, 249 days old at the end of the ’69-70 season.
Four other Chicago championship teams ranked in the top five. Jordan’s last dance with the franchise in ’97-98 came in 11th as the team stumbled out to an 8-7 record with Scottie Pippen recovering from foot surgery. The only teams to have a worse record to start a season in which they won the title were the ’50-51 Rochester Royals (now Sacramento Kings) and ’98-99 San Antonio Spurs (both started 7-8).
That Bulls team actually had the sixth-best offensive rating in the league behind the Lakers (7.47), Seattle SuperSonics (6.95), Indiana Pacers (5.14), Utah (5.13) and New Jersey Nets (4.28). Chicago’s defensive rating, however, was the best of the dynasty despite not leading the league. The Bulls trailed San Antonio and the Cleveland Cavaliers.
In the playoffs, Chicago had to endure a grueling seven-game series with the Pacers and a six-game battle with the Jazz in the Finals. The Bulls were getting up there in age, becoming the only team to win it all with its top three players in total minutes all at least 34 years old (Jordan, Dennis Rodman, Ron Harper).
It’s interesting to note the ’92-93 Bulls’ – Jordan’s last season before his first retirement – objective place in history and absence on this list. If we expand this model to include non-championship teams from 1986-87 to 2018-19, that team ranks 56th. That team completed a three-peat but won 57 regular-season games – three fewer than the New York Knicks and five fewer than Phoenix.
The Bulls outscored opponents by 6.3 points per game. They had a 7.63 overall rating, which was still the best for that season (Seattle was interestingly second at 6.93), but it was a significant drop from the previous season (11.51). They went 15-4 in the playoffs in ’92-93 – a better record than the year before – but their playoff point differential (5.9) was actually better during the 15-7 ’91-92 championship run (6.2).
This raises the question of how exactly do the Bulls teams of peak Jordan compare to each other?
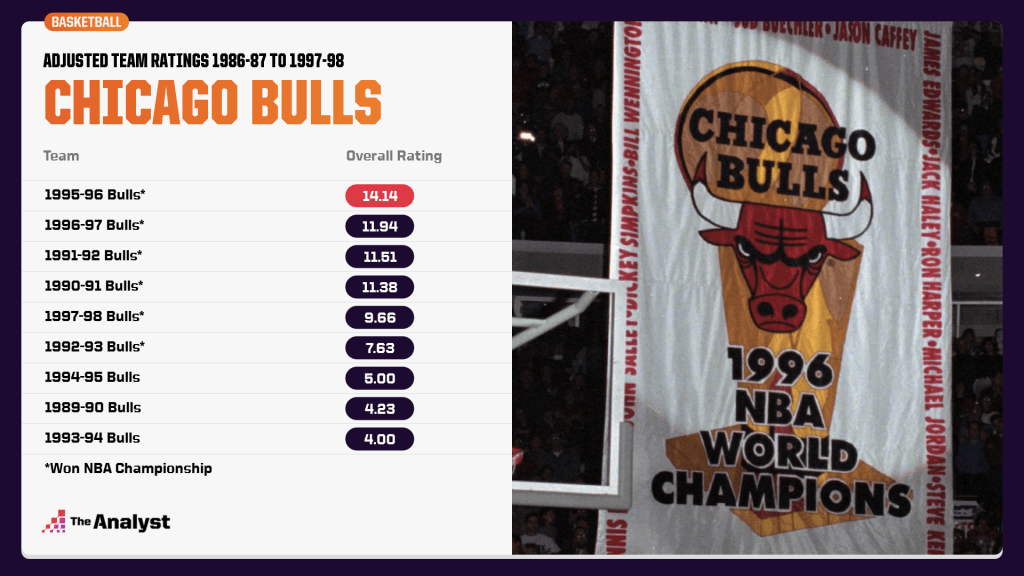
There aren’t many surprises with the top six, but it’s interesting to note the Jordan-less year of ’93-94 ranks ahead of most of the seasons preceding the first championship. Pippen was a game (and some would say a call) away from taking the 55-win team to the conference finals without Jordan.
The “Relaunched” year of ’94-95 when Jordan returned in March ended in the second round against Orlando, but that team’s overall rating is higher than any Bulls team that didn’t win a title.
Sandwiched between those two seasons impacted by Jordan’s retirement is the one that led up to the dynasty. The ’89-90 season was the Bulls’ second straight trip to the Eastern Conference finals, where they lost in seven to the eventual champion Detroit Pistons. Those repeat Pistons teams went 8-1 in the NBA Finals against the Lakers and Portland.
The underdog Bulls – an odd phrase to write – went 5-8 against Detroit in the conference finals series, and the reality is they were probably making them closer than they should have been. The Pistons led the league in overall rating in both ’88-89 (8.35) and ’89-90 (7.45). The Bulls were ninth (2.50) and seventh (4.23), yet they were the only team to beat the Pistons in the playoffs that first season and were the only team to take more than a game in a series the next.
After those rough series with the Pistons, the NBA was essentially Jordan’s until that shot over Bryon Russell in Game 6 on June 14, 1998. Jordan finished with 45 points, the most by any player in their final postseason game in NBA history. He had six 40-point games in the playoffs from ’95-96 to ’97-98. The rest of the league had seven such postseason games, and no player had more than two such games. It boosted his points per game in potential series-clinching games to 34.2 with a 30-13 record.
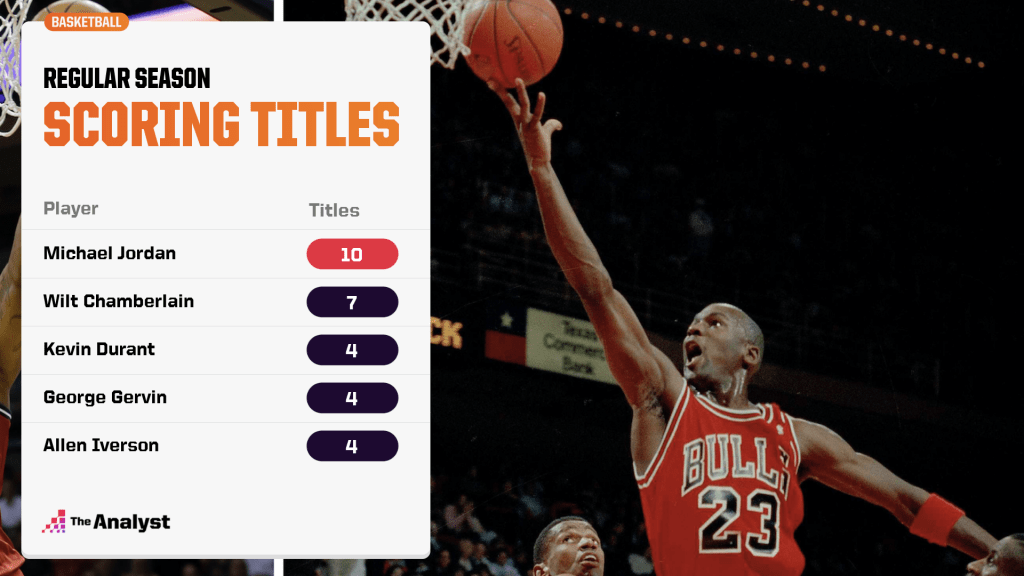
Jordan averaged 33.4 points in his playoff career – nearly four points more than any player ever. 1997-98 was the eighth time Jordan led the playoffs in scoring, two more than LeBron James. He won the regular-season scoring title that year as well. It was his 10th, which is three more than second-place Wilt Chamberlain on the all-time list.
It’s been more than 20 years since this all ended. Last year, you could walk by the Nike store on Paris’ Champs-Élysées and see jerseys for these four teams in prominent positions: The Warriors, Lakers, Bulls and Paris Saint-Germain.
The first will be of Steph Curry. In 42 regular-season games against Curry’s father’s teams, Jordan scored 1,316 points (31.3 per game), which is about halfway to the average NBA player’s career scoring total (2,801.1) in half a season’s worth of minutes.
The second will be of LeBron James, featuring Jordan’s No. 23. In Jordan’s postseason career, he led both teams outright in points in 130 of 179 games. That was a record until James passed it in recent years.
The third will be of Zach LaVine solely because Jordan for a time made LaVine’s current team the most recognizable on planet earth.
And the fourth will be of either Neymar or Kylian Mbappe. It won’t seem related until you look closer at the logo and see Michael Jordan’s Jumpman silhouette logo replacing the iconic swoosh on a global football jersey. Nearly a quarter of a century later, Jordan as a brand has in part replaced the brand that made him a brand.
These are the latest numbers at the roots of those cultural circumstances.
Data modeling by Matt Scott, and research support provided by Evan Boyd.
[1] On April 8, 1996, Dell Curry scored 19 points to help the Charlotte Hornets defeat the Bulls 98-97 in Chicago. Curry went 2 for 3 from 3-point range and 9 for 9 from the foul line. It dropped the Bulls to 66-9 for the season, ensuring they would at best remain tied with the yet-to-be set single-season wins record of Dell Curry’s son. Michael Jordan scored 40 points for the Bulls. Steve Kerr scored 12 points for the Bulls. Twenty years and five days later, Steph Curry scored 46 points for the Steve Kerr-coached Warriors to break the Bulls record. If not for his dad, he might have been settling for a share of the record.