
Will your team make a push over the final three weeks? We’re relying on our advanced data and expected winning percentage model to fill out the bracket with our MLB playoff predictions.
We hinted at a potential push by the Seattle Mariners in early July when they had the third-worst differential in terms of actual wins compared to expected wins.
And sure enough, the Mariners have gone on our predicted roll with a 39-19 record since July 1 – tied for the best mark in the American League over that span.
An offensive surge has played a large role in Seattle’s rise to the top of the AL West. Entering July, the Mariners ranked 13th in baseball with a team raw value+ (RV+) of 101.6 – barely above the MLB average of 100. Coming out of the Labor Day weekend, Seattle ranked sixth in the majors with an RV+ of 107.6.
(RV+ examines how a hitter performs throughout each pitch of an at-bat rather than just the result, and RV- does the same for a pitcher.)
The Mariners’ 5.9 RV+ increase is the fourth-best in baseball since July 1 behind only the Milwaukee Brewers (7.1), Philadelphia Phillies (6.6) and Minnesota Twins (6.5). Of course, two-time All-Star Julio Rodriguez has played a major role with the fourth-best batting average (.350) and second-most RBIs (51) in MLB during this run.
Fellow outfielder Teoscar Hernandez has heated up as well, batting .405 with eight home runs, seven doubles and 26 RBIs since Aug. 15. He’s moved up to seventh in MLB with a 172 BIP+, which measures how much damage a hitter does upon contact with the league average being 100.
Can the Mariners maintain their form in one of the most competitive divisions in baseball? Our expected winning percentage model still thinks so. It has them in a fight to the finish with the defending World Series champion Astros, with the Mariners ending up with 90.6 expected victories and Houston just ahead at 91.1.
This model isn’t really spitting out “projections” as much as it is providing us with an idea of what should happen if teams play to their expected form. It estimates how many runs each team would score and allow based on its RV and converts that into a winning percentage.
The model also uses “current roster” RV rankings to calculate a team’s expected performance instead of what the team has done throughout the season. For example, Justin Verlander’s RV- went with him to the Houston Astros following his trade from the New York Mets.
Our model has the Texas Rangers (90.1 expected wins) surviving their late swoon and holding off the Toronto Blue Jays (89.5) by a slim margin for the final playoff spot in the AL. The Texas bullpen has been the biggest issue with a 7.22 ERA during a stretch of 14 losses in 18 games. The Rangers have plummeted from second in MLB in relief pitching RV- (81.7) to 11th (90.4) over this span.
The model expected the Arizona Diamondbacks to fade despite being a National League West-leading 50-36 in early July and the Cincinnati Reds to collapse after they had won 20 of 24 games. That remains the case as the D-backs (81.6 expected wins) are likely to fall short despite their recent resurgence. They’re set to finish behind the Miami Marlins (83.7) and Reds (82.3), but ahead of the San Francisco Giants (81.5) in the fight for the NL’s third and final wild-card spot.
Four teams won 100 games or more last season, but the model only has the NL East-champion Atlanta Braves reaching that mark this year. Behind MVP candidates Ronald Acuna Jr. (second in RV+) and Matt Olson (eighth) and Marcell Ozuna (fifth), the Braves are easily No. 1 in offensive RV+ (120.2) and BIP+ (129.4).
They’re on pace to close out their best regular season since 1999 with 106 victories, while the NL West-champion Los Angeles Dodgers and AL East-champion Baltimore Orioles come close with 98.4 and 99.4 expected wins, respectively.
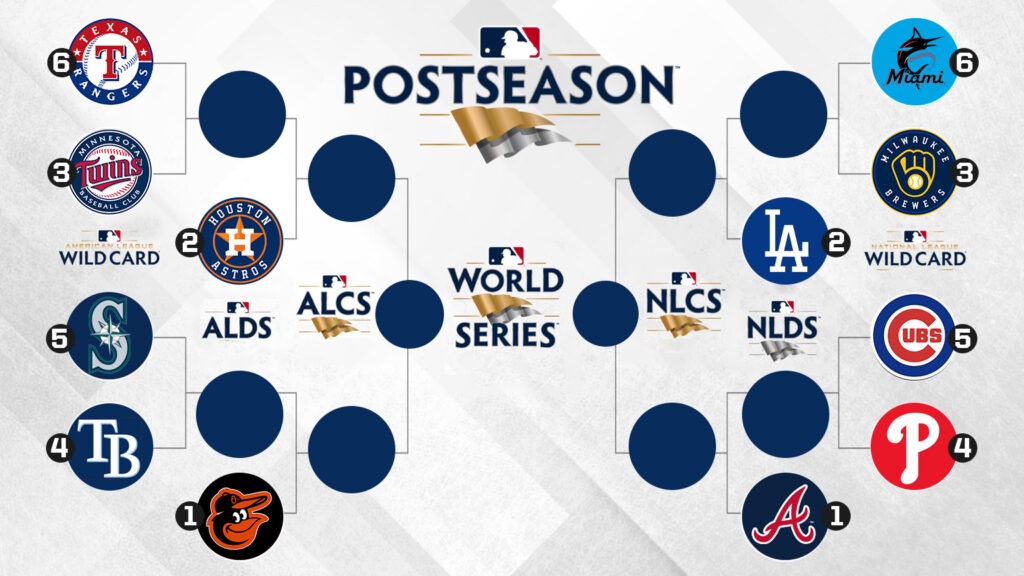
Expected Playoff Bracket
The previously mentioned Phillies have the second-highest increase in RV since July 1 and are expected to finish with the third-best record in the NL at 90-72. But they’ll have to make another run to the World Series from a wild-card spot since the Braves stand in their way in the NL East.
The offense that helped carry the team last year, ranking sixth with a 110.1 RV+, now sits 19th with a below-average 98.8 RV+. But Philadelphia is third in the majors in both starting pitching (88.2) and relief pitching (83.6), and first in overall whiff+ (112.9), which measures how good a pitching staff is at generating swings and misses. Zach Wheeler is second with an RV- of 60.4 and sixth with a whiff+ of 134.2, while Aaron Nola ranks 10th in RV- at 84.4.
The Brewers (89.5 expected wins) look like they’re going to take the NL Central and hold off the surging Chicago Cubs (86.8), who are on their way to the fifth seed and second wild-card berth.
With the top-ranked starting pitchers in baseball (83.9 RV-), the Minnesota Twins are expected to run away with the AL Central by somewhere around 12 games over the second-place Cleveland Guardians. That shouldn’t be a surprise since our model has been high on the Twins all season. But only the Kansas City Royals, San Diego Padres, St. Louis Cardinals and Los Angeles Angels have a larger differential between actual victories (72) and expected wins (79.9).
The Royals, however, are one of four teams expected to reach 100 losses with an expected record of 53-109, along with the Chicago White Sox (61-101), Colorado Rockies (59-103) and Oakland Athletics (50-112). Believe it or not, the Rockies have never lost 100 games in the history of the franchise.
The AL East could make history down the stretch with every team expected to finish above .500. That has never happened before, regardless of the number of teams in the division. Here is the model’s order of finish: Orioles (99-63), Tampa Bay Rays (96-66), Toronto Blue Jays (89-72), Boston Red Sox (84-78) and New York Yankees (82-80).
Like this? Follow us on Twitter for more.