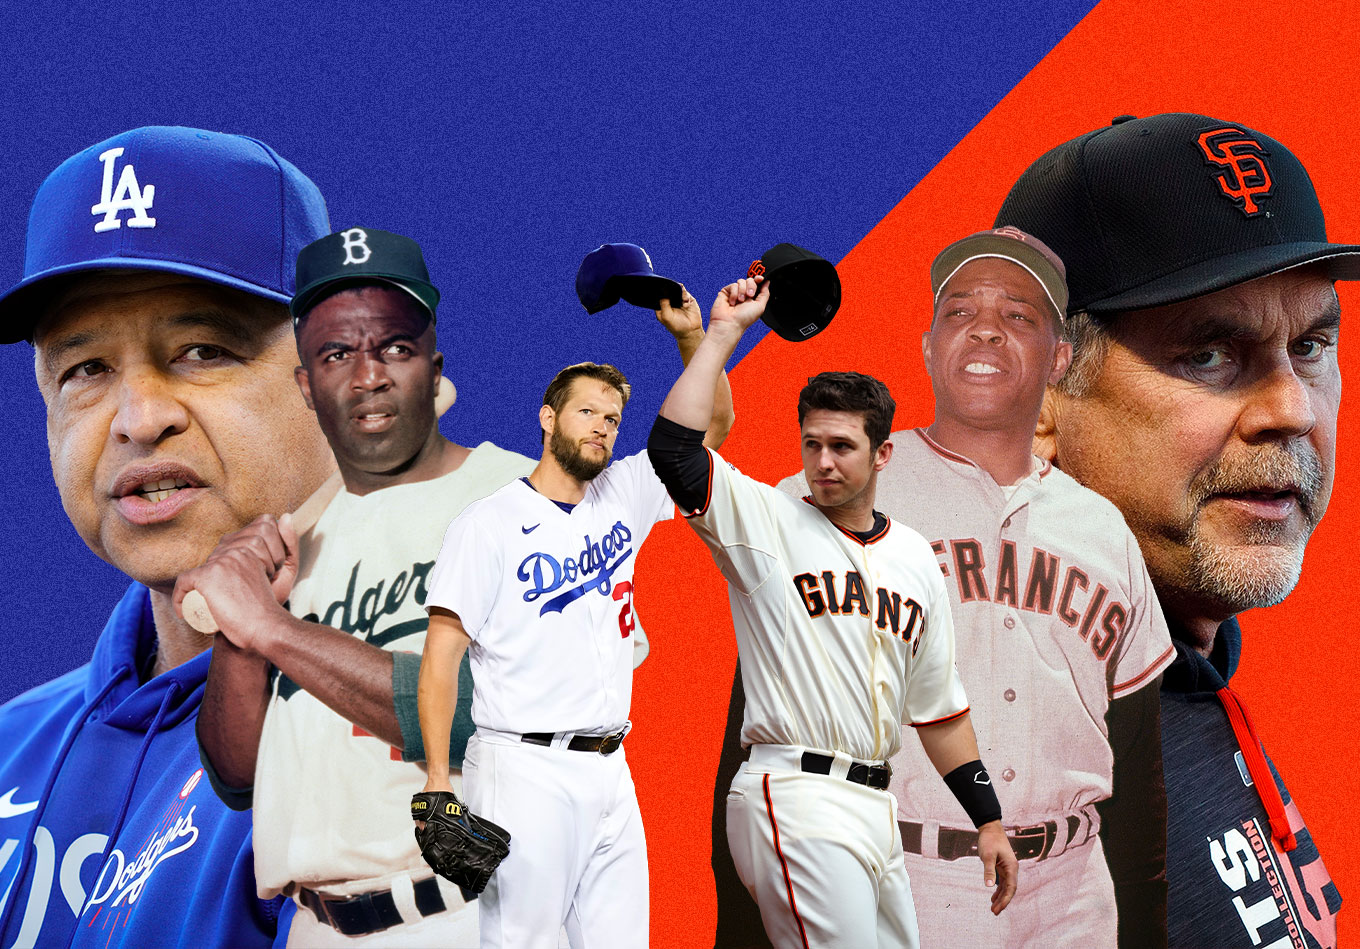
The Los Angeles Dodgers-San Francisco Giants rivalry enters its 133rd season this week. Telling the story comprehensively would take volumes, so we took a crack at showing it with fewer words and more data visualizations.
The “Shot Heard ‘Round the World” in 1951 still reverberates across all of baseball as one of the greatest moments in the history of the sport, while Clayton Kershaw’s career 1.88 ERA against his franchise’s biggest rival still causes nightmares for fans in the Bay.
The infamous 1965 brawl that saw Juan Marichal swing a bat at the head of catcher Johnny Roseboro highlights the intensity that seeps through whenever these two teams play. And the 2004 at-bat between the game’s greatest home run hitter and reigning NL MVP, Barry Bonds, and the reigning Cy Young winner, Eric Gagne, is still discussed and dissected as one of the sport’s greatest all-time matchups between two behemoths in the prime of their power.
All of the stories and signature moments make for great barbershop debates. They invite friends of all ages to endlessly debate about which player, manager, moment, or ultimately team, is better. But we won’t do that. We’re a numbers destination and that’s the lens in which we are going to view this rivalry.
The San Francisco Giants-Los Angeles Dodgers rivalry enters its 133rd season this week. With the two teams about to square off for the first time in 2022, the rivalry finds itself in scintillating form on the back of a historic 2021 NL West race for the division and a first meeting in the postseason in the modern era.
The Giants’ 107 wins were the most recorded in a single season by either franchise – ever. But the Dodgers got the better of them in the postseason. It continues a trend: There is no more evenly matched rivalry in all of professional sports than this one.
Don’t believe us? In 2,323 regular season games between 1903-2021, the Giants have outscored the Dodgers by five runs. Five!
This baseball season, we’re going to do a series called The Viz, in which we let data visualizations and tables do a bit more of the talking. The New York Yankees and Boston Red Sox rivalry was first. Giants-Dodgers has arrived and the St. Louis Cardinals and Chicago Cubs rivalry is still on the way. Enjoy.
The Regular Season
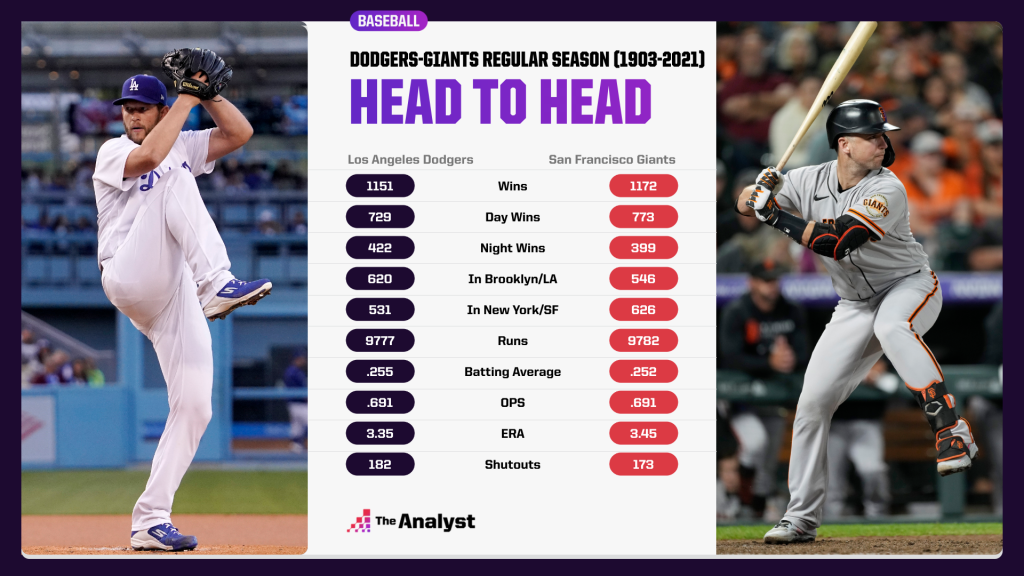
Of course, the number we must begin this breakdown with is 1,172. It’s the number of wins the Giants have in the regular season series since 1903. But this rivalry, as it has been in so many elements, is remarkably even.
The Giants have more day wins. The Dodgers have more at night. The Giants have scored just five more runs than the Dodgers. The Dodgers’ batting average is just .003 better. They have the exact same OPS. That’s about as level as it gets.
Up until 1968, the two teams competed for the NL pennant during the regular season.
Most notably, Bobby Thomson’s “Shot Heard ‘Round The World” in the 1951 NL tiebreaker between the Giants and Dodgers is among the most iconic moments in the history of American sports.
Then, MLB’s expansion in 1969 increased the number of teams to 24 and resulted in the creation of two divisions within each of the leagues, leading to what we now know as the League Championship Series. Los Angeles and San Francisco began playing for an NL West title each year and the Dodgers have dominated since the move to California, winning 19 division titles to the Giants’ nine.
The Dodgers won eight consecutive division titles from 2013-20 before the Giants snapped the streak in 2021 in one of the most thrilling division races in modern baseball history.
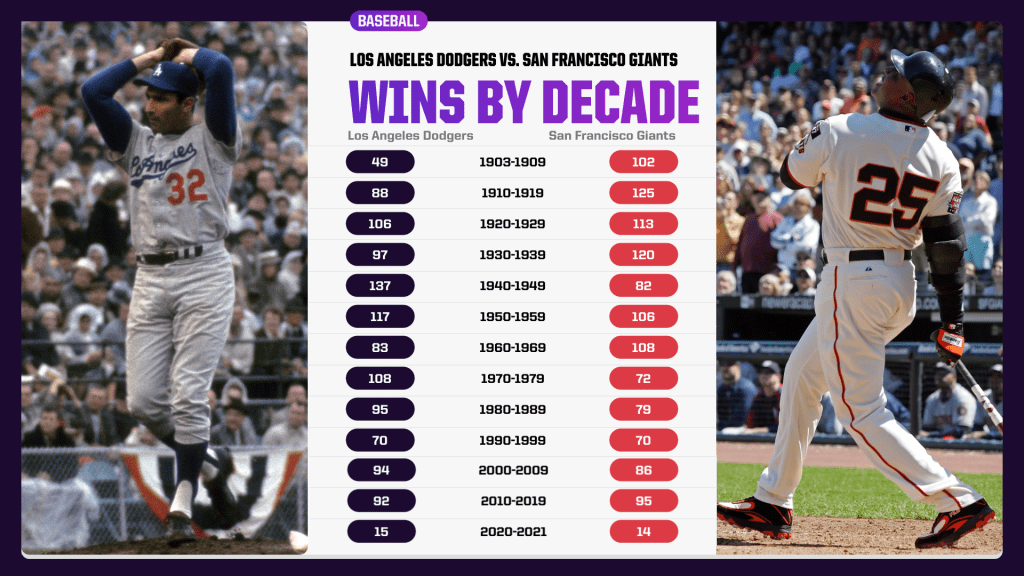
The first few decades of this series were completely dominated by the Giants. From 1903-39, the Giants went 460-340. The Dodgers earned the “Bums” nickname with good reason. But Brooklyn fired back in the ’40s and ’50s, bringing the series in New York (1903-57) to a closer 624-574 margin in favor of the Giants.
After the move to the West Coast, the Dodgers held serve, leading the Giants 577-548. Of course, that wasn’t without more even play, as the two teams each won 70 games in the ’90s. And even with LA’s division dominance in the 2010s, the Giants still won more games.
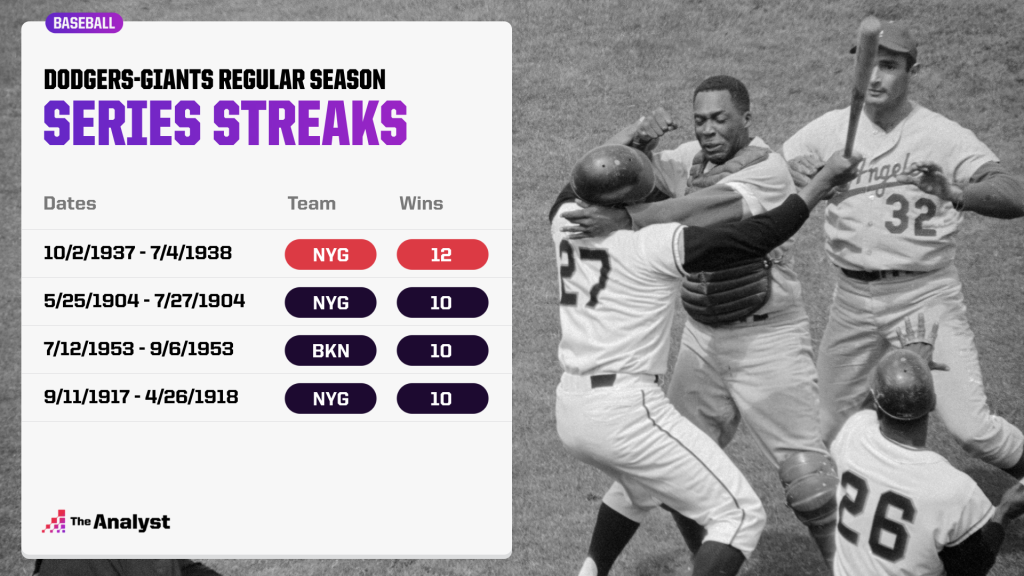
The Giants own three of the four winning streaks in the series that have lasted at least 10 games, though none of the four streaks had any significant impact on the win count for that decade (the Dodgers’ 10-game win streak in 1953 did push them to an 11-win margin in the 50s).
As we’ve seen already, in a long, historic rivalry like Dodgers-Giants, there will be plenty of even seasons and even statistics. And, of course, there will be some drastic differences.
In the data visualization below, we’re looking at each team’s season-by-season numbers, then comparing them to a 10-year moving average for each metric. The outlier seasons from those rolling averages are highlighted.
For example, we can note the Giants’ .319 team batting average in 1930, which is the best single season team batting average by any team in MLB from 1903-2021. And, on the flip side, the Dodgers’ – then known as the Superbas – batting average in 1908 (.213) is the third-worst mark in MLB in that same stretch.
But this goes both ways. Los Angeles’ 279 home runs in 2019 ranks fourth most in a single season all time. San Francisco’s 94 home runs in 2008 are the second fewest in a full, 162-game season since 1996.
Don’t forget: Some of those seasons, such as 1981, 1994 and 2020 were shortened seasons, so season totals for counting stats will naturally be lower.
We can also visualize this by plotting runs per game and ERA for each team over the past 25 years, giving us a better understanding of each team’s success in the most modern era of baseball.
The 2020 World Series champion Dodgers were easily the most dominant team of this stretch, averaging 5.82 runs per game and compiling a 3.02 ERA.
Even for these storied franchises, 2021’s unbelievable year for both clubs does not even crack the top five in terms of single season winning percentage. That’s despite the Giants setting a single-season win total record and the Dodgers matching their 106-win record from 2019.
Also, we’re once again eliminating ties. The Giants, for example, had five ties in 1904.
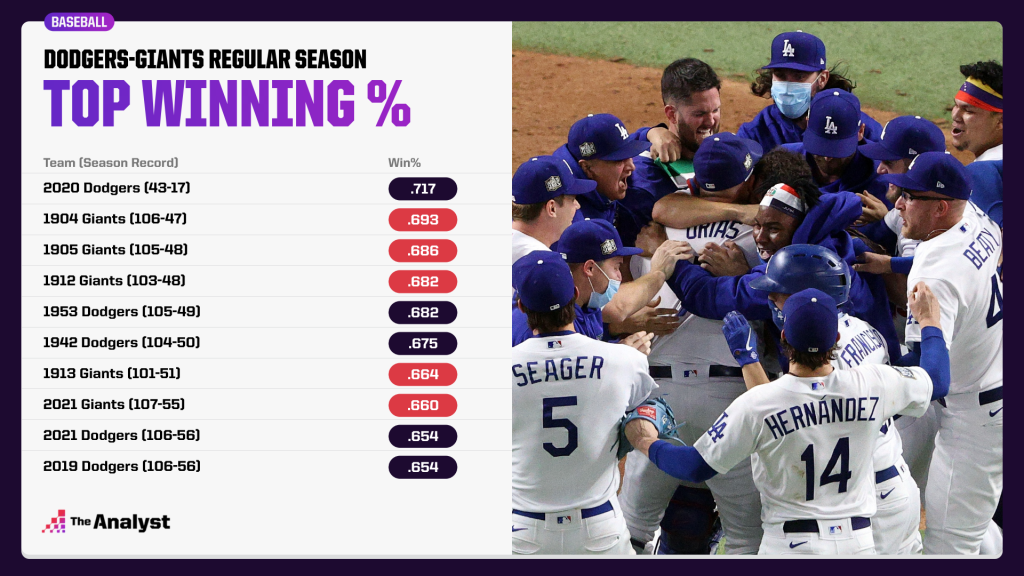
Would the Dodgers have continued their 116-win pace in 2020? It’s hard to say one way or the other. But this list does give an indication of just how dominant LA has been over the past few seasons.
And, if you’re wondering who’s next on the list, the 1941 Brooklyn Dodgers went 100-54 – good for a .649 winning percentage.
The Managers
The Dodgers have had 31 managers. The Giants have had 37. Below is a list of managers between the two clubs that have spent at least 100 games in the dugout for their respective team since 1903.
Unfortunately, that excludes Clyde Sukeforth, who went 2-0 in 1947 for the Brooklyn Dodgers in Leo Durocher’s stead while he was suspended from baseball in 1947. Burt Shotton managed the remainder of the games that season.
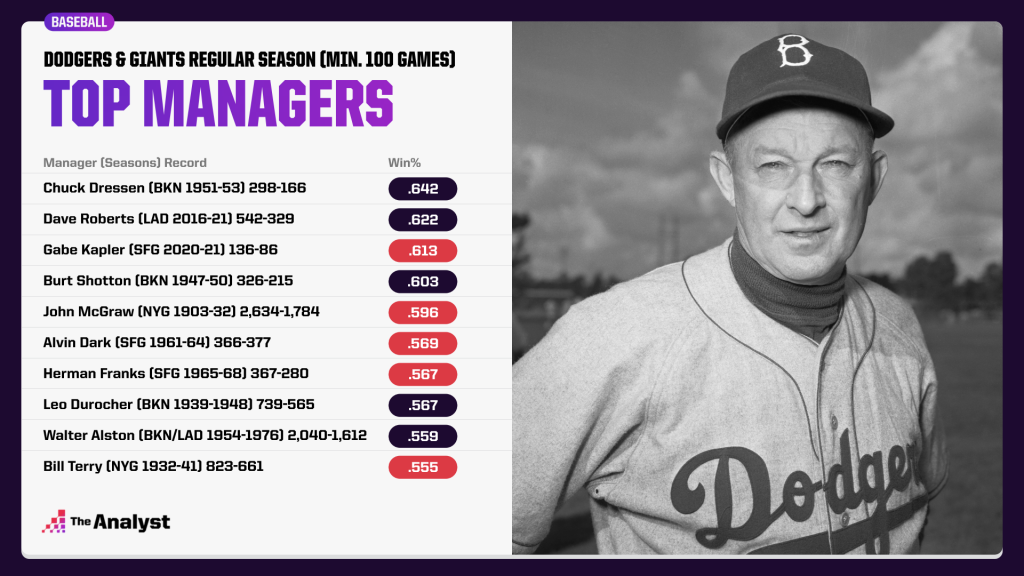
It’s remarkable how even the Dodgers and Giants are. Each had five of the top 10 winningest seasons. Each have five of the top 10 winningest managers. And the parallels don’t end there. You’ll see Leo Durocher slotted in eighth place with a .567 winning percentage with the Dodgers from 1939-48. He actually parted ways with the Dodgers midway through the 1948 season to go manage the crosstown rivals from 1948-55. He won the World Series with the Giants in 1954, a feat he never accomplished with the Dodgers.
In case you’re wondering, Dodgers legend Tommy Lasorda ended up with a .526 winning percentage (1,599-1,439) from 1976-96.
But while regular season success is fun, the best way to stick it to your rivals is to win in the postseason. Since 1903, 22 managers between the two teams have made the playoffs with one of these clubs, with 20 having won a playoff game.
Below is another data visualization, charting winning percentages by regular season and the playoffs for all managers to win at least one of each.
You’ll see our friend Durocher there with a .600 winning percentage in the playoffs with the Giants, and a .200 winning percentage in the playoffs with the Dodgers. In the top left, Bruce Bochy, who had a losing record in the regular season (1,052-1,054), ran roughshod through the postseason, winning three World Series and compiling a .679 playoff winning percentage. Dave Roberts, the leader of this current and historic Dodgers run, leads the way with 44 playoff wins – most among either team.
Gabe Kapler, San Francisco’s current manager, has the best regular season winning percentage among Giants managers, albeit with just two seasons under his belt (and one being COVID-shortened 2020). But he lost his only playoff series as manager in the 2021 NLDS to…Roberts and the Dodgers.
The Playoffs
Remarkably, there wasn’t a single postseason game between these two teams until in 2021. So by virtue of their Game 5 triumph last season, the Dodgers hold a 3-2 head-to-head record against the Giants in an incredibly limited sample size.
The Dodgers (128 wins) and Giants (100) are two of the six franchises that have reached the 100-win plateau.
More than a third (38) of the Giants’ postseason wins in franchise history have come since Buster Posey entered the league and led the Giants to glory in 2010. Meanwhile, 52 of the Dodgers’ postseason wins have come since 2013.
The World Series
The Dodgers have represented the National League 21 times – the most among any NL franchise. Of those 21, they’ve won seven, but have come out on the losing side 14 times. Those 14 losses are more defeats than any other franchise has experienced, including a Yankees franchise that has been to the World Series a whopping 40 times.
Only two NL teams have won more World Series than the Dodgers’ seven, but one of them is the Giants – a team that went through its first 54 years in San Francisco without a title.
The Giants turned four total postseason appearances from 2010-19 into three World Series championships, catapulting themselves above the Dodgers into sole possession of fifth amongst all MLB organizations. The decade was owned by these rivals, however, as they combined to represent the National League in five of the 10 Fall Classics.
Back in 1905, the New York Giants won the second World Series ever contested, which began a streak that saw the Giants record eight (and win three) World Series appearances in 20 years under legendary manager John McGraw. By the time the Giants won their fifth title in 1954, their Brooklyn rivals had yet to win one, losing their first seven appearances in the World Series. The Brooklyn Dodgers finally broke through the following year in 1955, winning their one and only title before moving to Los Angeles.
Once in LA, it didn’t take the Dodgers long to win again, becoming the first West Coast team to win a title in 1959 – the organization’s second year in Los Angeles. Four more World Series titles in 30 years and the Dodgers pushed past the Giants in total World Series championships, creating the circumstances with which we entered the 2010s.
Add it all up and the Giants have won more World Series titles. But the Dodgers have won more since the teams moved to the West Coast. Yet, the Giants have won more World Series titles this century. But the Dodgers won the most recent one.
Whatever this debate is certainly won’t be settled when these teams walk onto the field at Chavez Ravine and play a quick two-game series to open the 2022 edition of the rivalry. But therein lies the beauty of baseball.
What we do know is that something is likely to happen that will only add fuel to the fire of two extremely passionate fan bases.
Data visualizations by Peter McKeever. Graphic design by Matt Sisneros.
Enjoy this? Subscribe to our mailing list to receive exclusive weekly content.