For the 2021-22 season, we’re introducing the Stats Perform AI team’s player performance model, which projects offensive, defensive and overall adjusted plus/minus. The leaderboard updates daily.
Since the early years of basketball analytics, many have attempted to condense player statistics into easy-to-digest metrics, including the ‘all-in-one rating.’ Metrics like RAPM, BPM, and RPM have all been used to describe overall player performance, or even used to predict future performance.
In the last few years, these metrics have quickly grown in number and scope, such as DARKO DPM, LEBRON, EPM, and RAPTOR. While all-in-one ratings can oversimplify a player’s attributes, they are extremely powerful for team projections, injury adjustment, and having a good baseline for overall player value.
Enter Stats Perform’s DRIP. Like, “Russell Westbrook has DRIP, but LeBron has even more.”
Our approach is similar to that of PIPM and DARKO DPM: We take box score, play-by-play and lineup data, and predict each player’s contribution to their team’s offensive and defensive ratings for the regular season. But rather than averaging these input statistics over a single season or career, we ‘now-cast’ a player’s current ‘true talent’ estimate for each stat. This part of the model can answer questions like “What is Giannis’ current 2-point percentage?” or “How real is Michael Porter Jr.’s scoring jump?”
Here’s how it works:
Player Priors
For rookies, we use simple attributes like height, weight, age and draft pick number to predict the first game of a player’s career. To do this, we built a model for previous rookies in our dataset and come up with an ‘adjusted game 1’ estimate for each stat. Careful work was done to ensure that these projections are not used to develop the models for the rest of these players’ careers.
Time Series Features
Most player ratings tell you a player’s contributions over the course of a single season, or maybe even roll up several seasons. This has two issues: first, many players have a very small sample size. If a player shoots 7 of 10 from 3, it would be foolish to assume they’re a 70% 3-point shooter, rather they just got a bit lucky. Second, if a player has improved significantly over the course of 20 games or so, an entire season’s worth of data will paint them in an unfavorable light. We find the optimal middle ground, using time series features. Much like DARKO, we use the padding method, bayes filters and more to achieve a good baseline ‘now-cast’ for each stat a player accumulates. So rather than using a single game, season or career worth of free-throw percentage, for example, our model uses all available data on a player, starting with their rookie prior.
Sliding Position
Player position is an extremely useful tool in contextualizing +/- data. To improve model fit and give us future flexibility, we have also modeled player position. Rather than simply classify each player as a point guard, shooting guard, etc., we estimate each player’s current projected game position based on statistical markers such as passing and rebounding. This range for positional estimate on our ratings page is from 1-100, where 1 is the most true point guard-like and 100 is the most true center-like.
Machine Learning
We take all these features as inputs and run them through gradient-boosted decision trees to come up with high-quality next-game projections for each player. Note that these projections are in a vacuum and don’t account for opponent strength of their scheduled next game.
Robust Personalized Player Models
Given that all players are very different from each other, we find that even machine learning models have trouble projecting their abilities; this is particularly evident with outlier players. One good example is Stephen Curry, who our traditional approach pegged maxing out at between a 40% and 41% 3-point shooter. Problem is, he’s been significantly better than that for a large portion of his career. Excluding 2016-17 and his five-game season in 2019-20, Steph has shot above 42% every season of his career, including shooting 44% or higher in five out of six seasons from 2010-11 to 2015-16. Because of this, we have done careful work to create personalized models for certain statistics. See Steph Curry below:
The same results happen for a player like Joe Harris, who is fourth all-time in career 3-point percentage at 43.8%:
Predict Adjusted Plus/Minus
Much like other all-in-one basketball metrics, we take each of our statistical outputs and project player contribution to plus/minus per 100 possessions on both offense and defense, using adjusted +/- as our target. This final result is DRIP on offense, defense and in total.
Now, let’s apply it historically, first looking at offensive peaks dating to the 2012-13 season. This is limited to one value per player in order to show more variety:
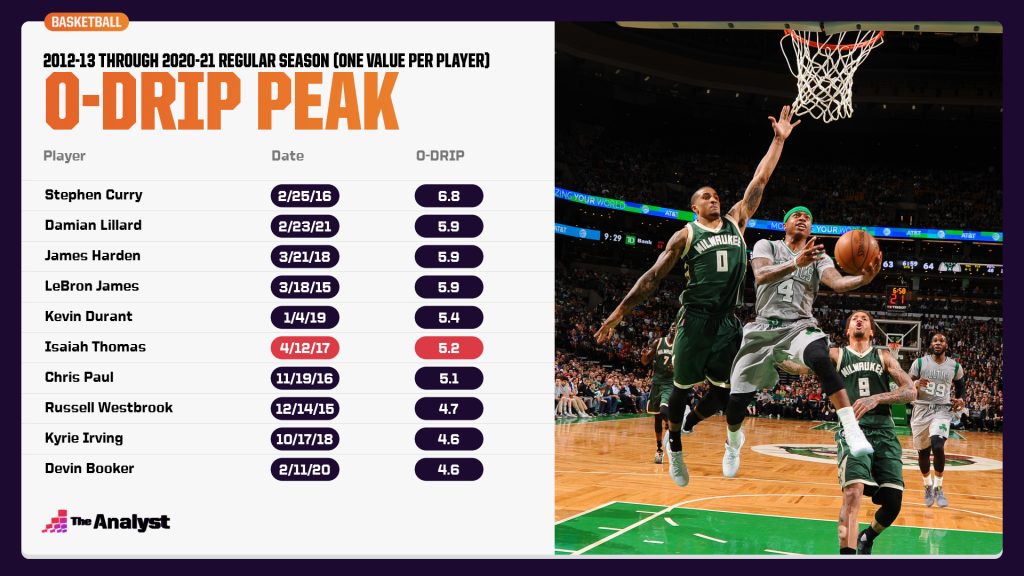
Isaiah Thomas, in his final year on the Celtics, was one of the most impactful offensive players in the league. While 2016-17 was his only season in the top 10 for points per game (he finished third!), DRIP felt this run was legitimate, with a higher peak than even Kyrie on offense. For Thomas, his scoring and jump in efficiency was validated by other markers, such as an improved free-throw percentage (his then-career high of 91%). This led to a greater ‘trust’ in his improved 3-point shooting (a tied-for-career high of .379). While an average fan might feel Thomas was playing phenomenally, our machine-learning model enables some affirmation of those beliefs, since the model is predictive in nature.
At the other end:
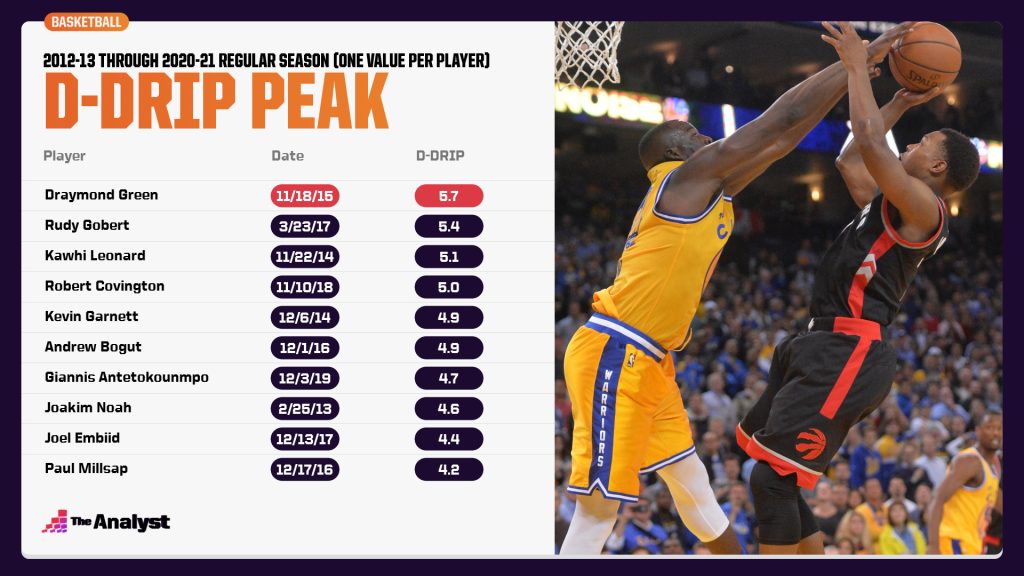
The peak Warriors were no doubt famous for 3-point bombs from Klay Thompson and Steph Curry, but it was eventual-DPOY Draymond Green who held things down on the other side of the floor. In 2015-16, the Warriors were 12 points per 100 possessions better defensively with Draymond on the floor, and Draymond had near-top of the league marks in both Block% and Steal%. Defensive DRIP likes Draymond’s peak most, beating out even 3-time DPOY Gobert’s best.
We’ll be using DRIP extensively in our NBA coverage this season, and we’ve included it in our NBA leaderboard. Future related work will include luck-adjusted lineup data and using tracking data to better predict rookie priors.
DRIP was created by Nathan Walker, the author of this piece, with contributions from Stats Perform AI team members Lucas Haupt, Matt Scott and Kyle Cunningham- Rhoads. Also, a big thanks to Kostya Medvedosky.