We recently introduced our new and improved possession value model and alluded to its applications with other frameworks. One such example is movement chains, which we introduce here.
Existing models, such as our possessions and sequences framework, allow us to segment and analyse passages of play with descriptive metrics such as passes per sequence and direct speed. However, this only gives us a high-level overview of a team’s style or a player’s involvement and it is often too complex to group similar sequences together for deeper analysis.
Movement chains give us a whole new layer of detail.
What Are Movement Chains?
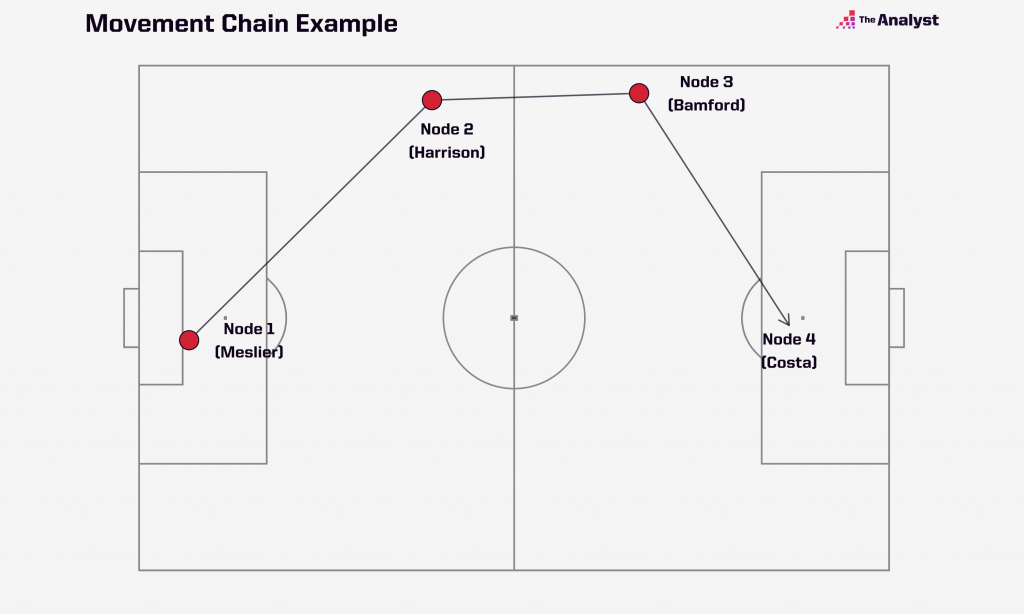
Movement chains describe the pattern of four consecutive player involvements in an uninterrupted passage of play by displaying the locations of the first touches of the players involved, where a player can be involved more than once within the chain. The first touch of each player involvement in a movement chain is referred to as a node.
We can see how this works in a chain in the build-up to Leeds United forward Hélder Costa’s second goal vs Fulham earlier in the season.
Illan Meslier plays a lofted ball to Jack Harrison, who heads it down the line to Bamford. Bamford then carries the ball before squaring it to Costa to score. Each node indicates the location of the first touches of the four player involvements.
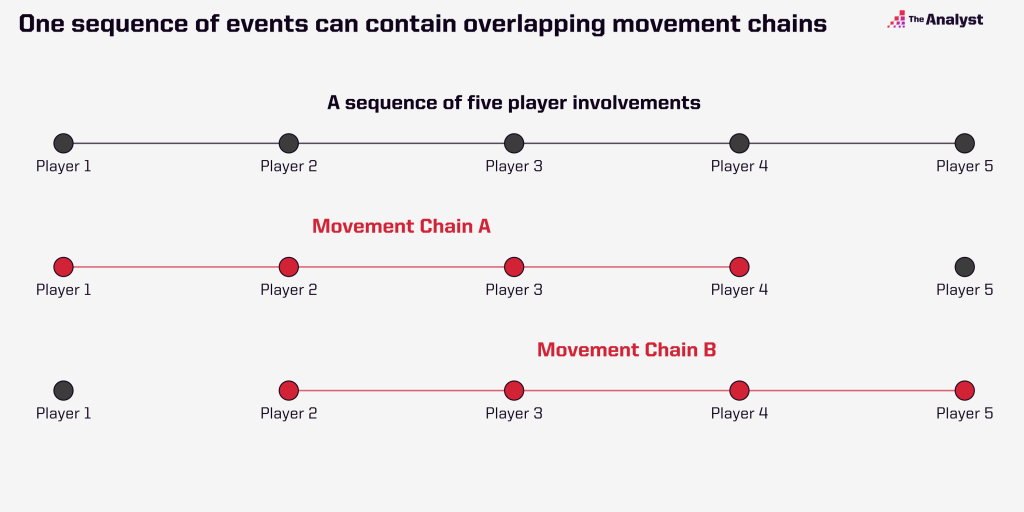
Each node in a passage of play can be classified to more than one movement chain. For example, we also have a chain starting with Robin Koch’s pass to Illan Meslier that would end after four involvements at Patrick Bamford. Here three of the nodes overlap between unique movement chains.
Movement chains were built to give context to a player’s role in certain patterns of play and give a holistic view of style at the team level. Is Pierre-Emerick Aubameyang involved in dangerous chains down the left wing or more centrally? What do Liverpool’s most dangerous chains look like?
We currently have two types of chain:
- Non-Cross/Passing chain: These chains are the most common movement chain, where players pass the ball between nodes. We will focus on these throughout this blog.
- Cross chain: These chains contain completed crosses by the third of the four player involvements in the sequence, where the third player crosses to the fourth player in the chain. In these cases, we record both the first touch and the cross location of the third player.
Clustering Movement Chains
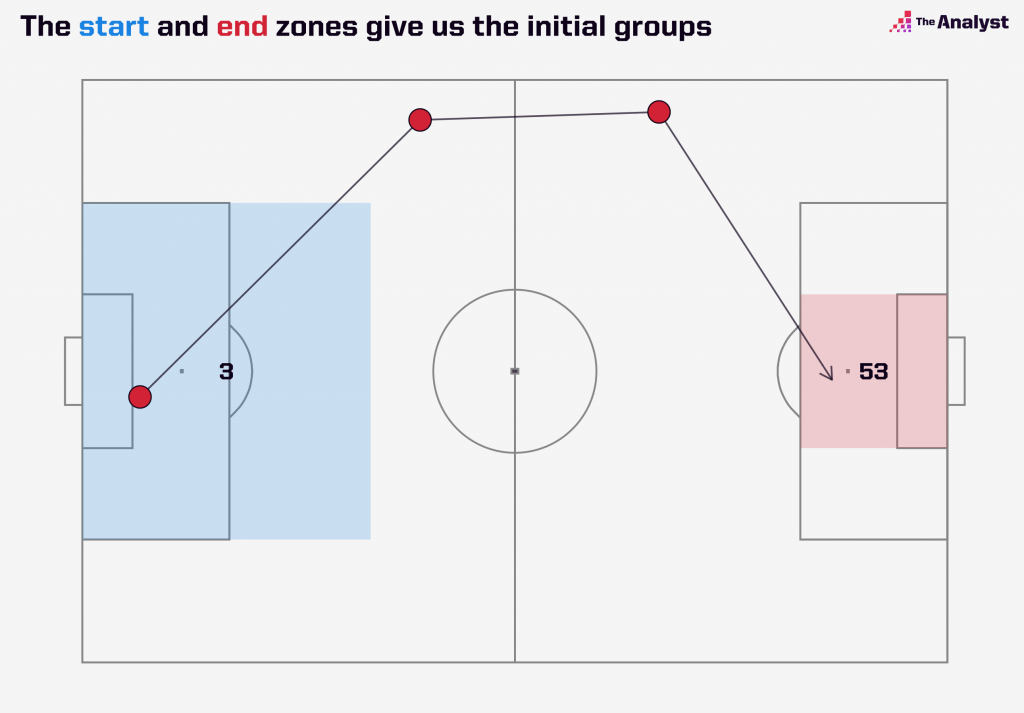
In order to extract the most value from these individual movement chains, we need to categorise them into groups based on their spatial similarity. First, we split the chains down based on their start and end locations, determined by the zones shown below:
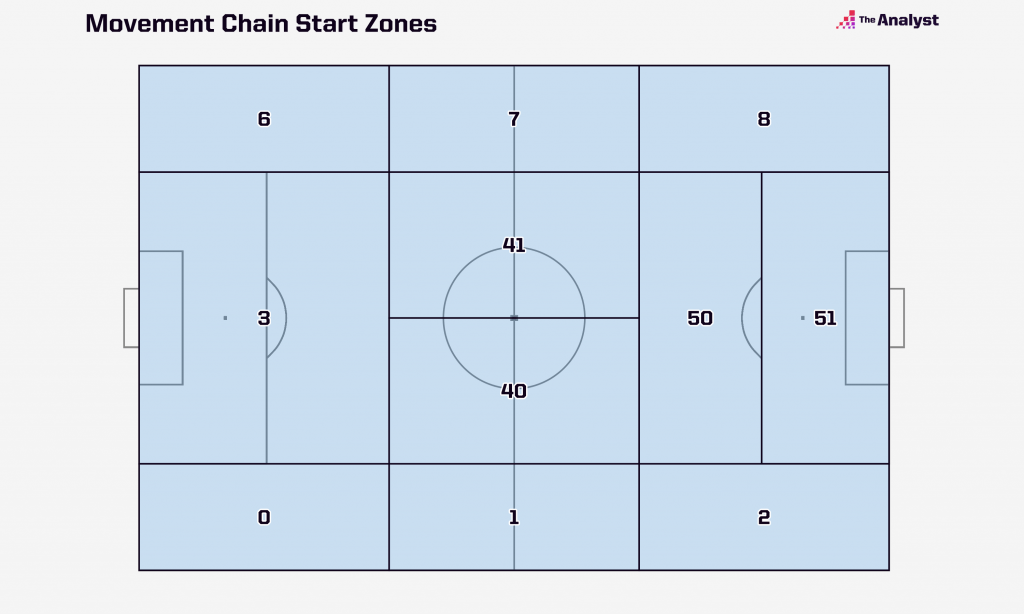
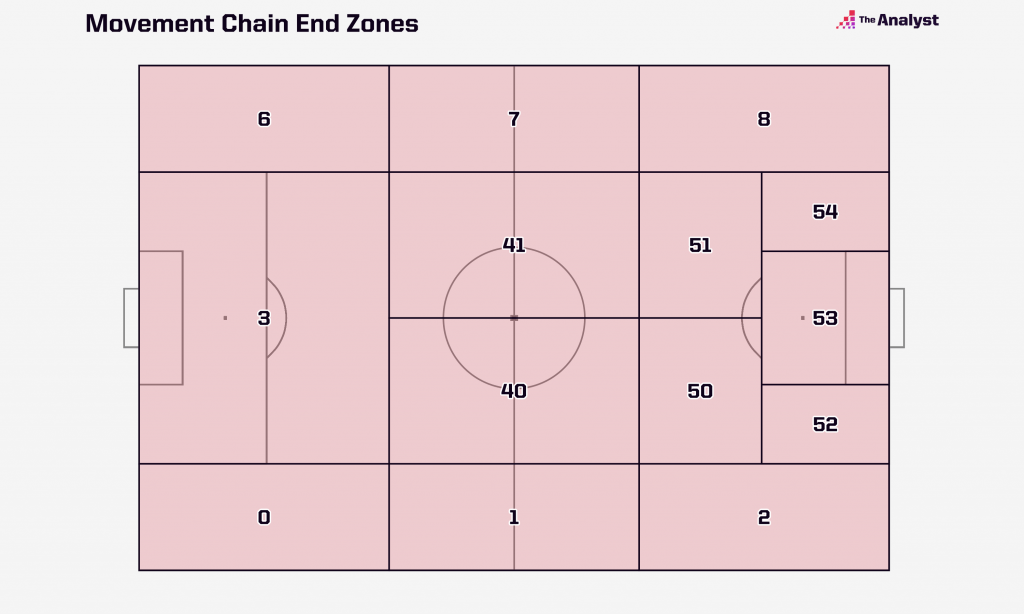
The reason we do this is to inject domain expertise into the model. We could just cluster on the chains as they are but the lack of chains finishing in advanced areas (e.g. the penalty box) would result in them being pulled into other clusters further away from goal.
Therefore, by segmenting the pitch into zones we ensure we generate clusters that accurately reflect what happens on the pitch.
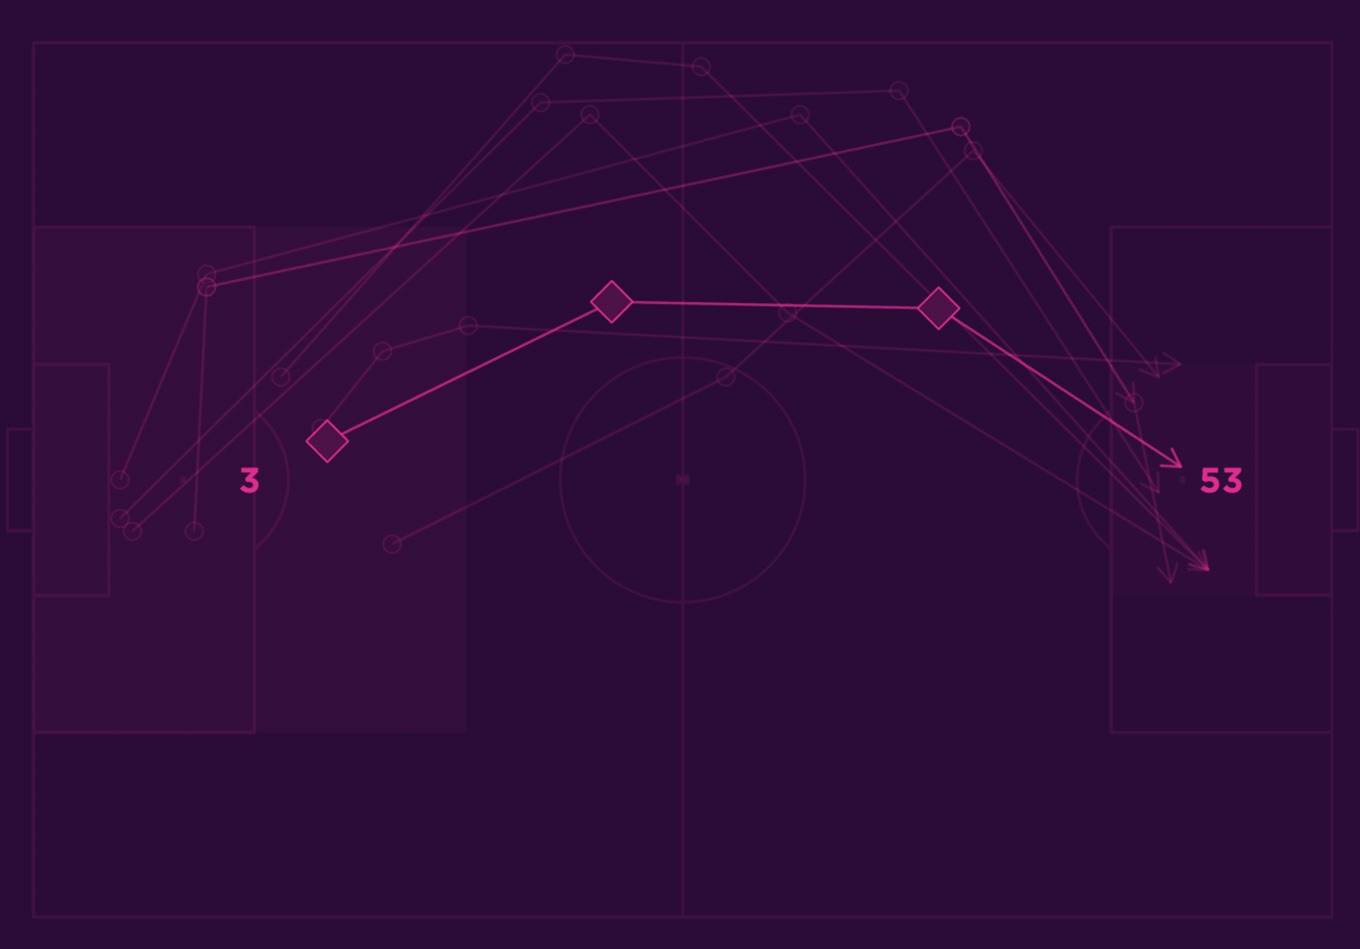
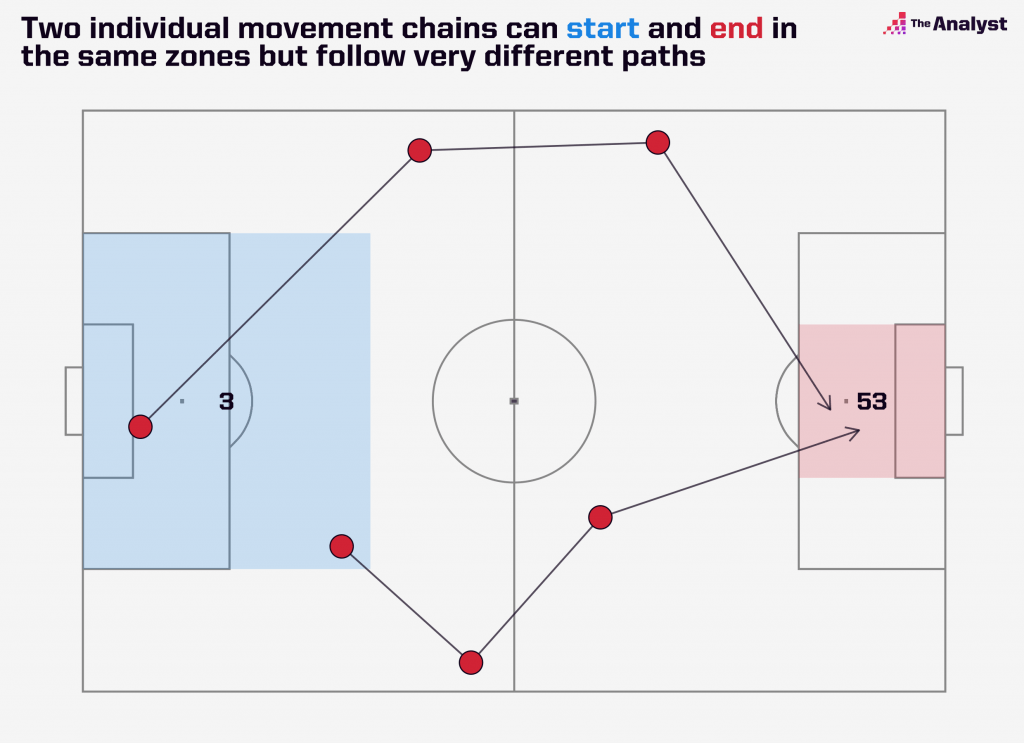
This gives us our base level of information about the chains, but we then need to differentiate between movement patterns within these groups. For example, the two movement chains below both start and end in the same zones but have very different trajectories.
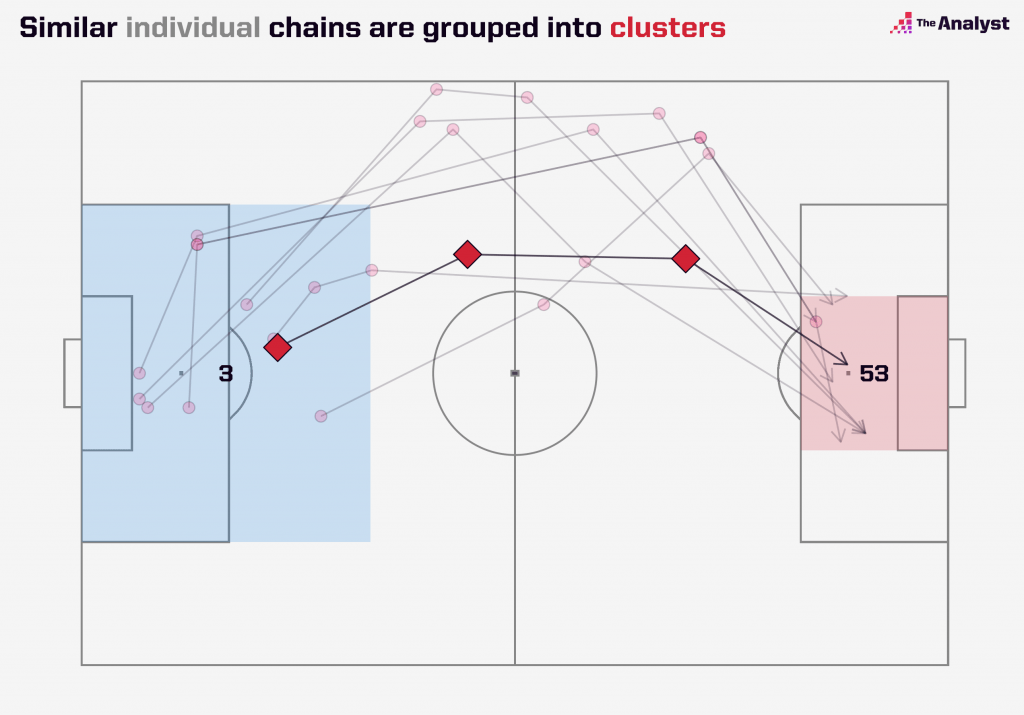
To do this, we add a cluster (or pattern) label to each chain within these zone groups that fits the most spatially similar chains together. These cluster labels describe the shape of movement between that specific start/end zone and are created using a K-means clustering algorithm, with a pre-chosen number of groups based on our analysis.
The graphic below displays all of the chains in the Premier League this season that started and finished in the same zones as our Leeds United example, that also belong to the same cluster label. We can use these clusters, represented visually by the global centroids of each node, to evaluate the most frequent and most effective patterns of play employed by a team.
Motifs
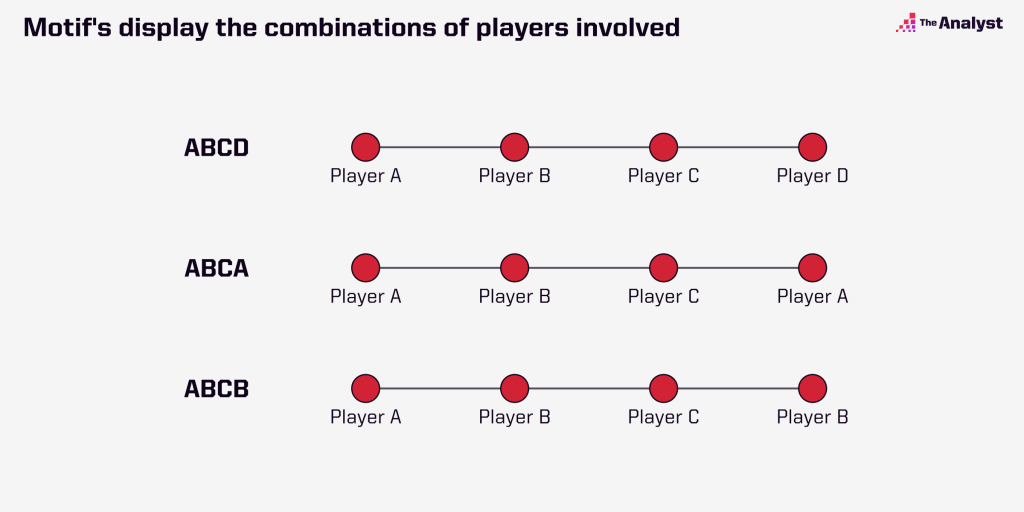
While the locations of each involvement and their trajectories are fundamental, we can also extract information about the involvements of players through motifs. Motifs assign letters to each point of a chain that indicate the order of a player’s involvement and combine to create a “word” for the whole movement chain.
An example of a motif could be “ABCA”. This would mean that the first three involvements in the chain were all unique players (player A, player B and player C) but the first player in the chain (player A) was also the last player involved. In our Leeds United example, there were four unique players involved so this would be labelled motif “ABCD”.
This context allows us to see the types of combinations in these chains and how these stylistic features differ between players and clubs. For example, which teams are playing one-twos in and around the area? Is Kane involved in the build-up to shot-ending chains that he’s also getting on the end of? And so on.
Limitations
While it is important to understand what movement chains can measure, as with any model, it is key to understand their restrictions:
- Chains do not tell us what happens in between players receiving the ball and passing. A player might carry the ball before passing to the next player (e.g. Patrick Bamford in our example) or they might play a first-time pass.
- Chains do not include in-game information that didn’t take place in a chain. For example, shots which aren’t preceded by three passes won’t be included in a chain.
- Chain lengths are restricted to four involvements in order to reduce the complexity of the data for more advanced analysis with clustering and motifs.
Movement Chains in Edge Analysis
On top of the features of movement chains shown here (e.g. clusters and motifs), we can also apply other AI models (e.g. possession value, expected passes and pressure) to each node to enhance our understanding of the context in which these patterns of play are being used.
For example, in Stats Perform’s Edge Analysis platform, we demonstrate the power of movement chains by finding the most dangerous patterns that teams use (according to possession value) and link this to the video instances to study the plays of most interest to the user. We do this analysis at the cluster level, where each yellow line below represents a cluster that contains individual chains that meet the search requirements:
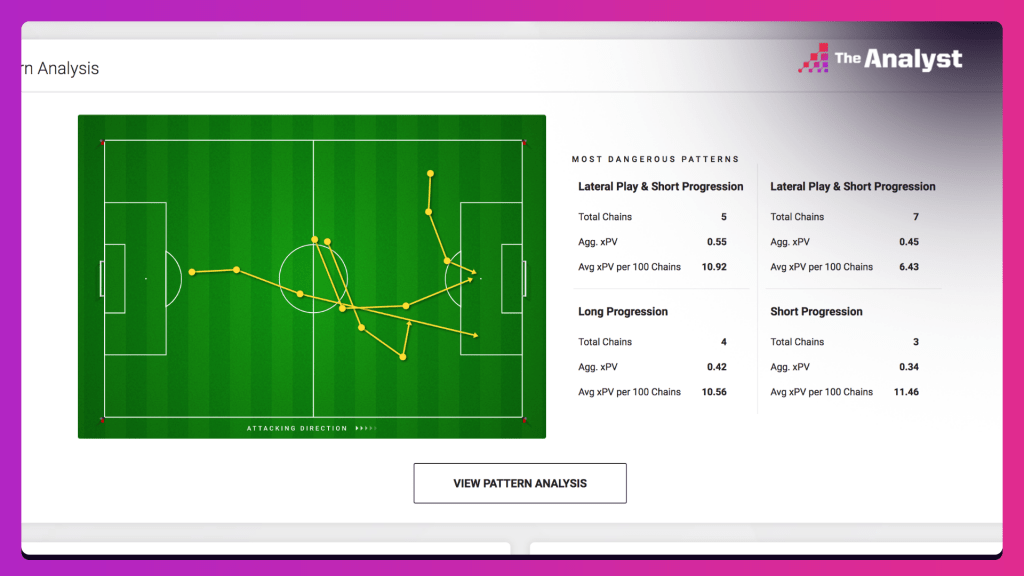
The various applications of movement chains mean that we can use them in isolation or within wider models to create a more sophisticated understanding of player and team styles and apply them in areas such as recruitment and opposition analysis.