
Stats Perform’s possession value (PV) framework measures the probability that the team in possession will score during the next 10 seconds, and can assign credit to individual players based on their positive and negative contributions on the ball.
Since its introduction last year, Stat Perform’s possession value model has become an essential tool in our innovative AI models that power our Edge Analysis platform.
Over the course of the 2019-20 season, with the help of client and user feedback, we evolved a number of features in the model framework. The new possession value (PV) framework was developed in response to concerns around the aggregation of the existing version at the game level, where team values were generally far larger than actual goals scored. In contrast to the original possession value framework that measured the probability that a team would score from their possession, the new possession value (PV) framework now uses a time-based approach, measuring the probability that a team in possession will score during the next 10 seconds. This approach was taken due to its superior model performance in comparison to different methodologies and alternative target variables, giving us much more interpretable outputs.
Another significant alteration to the framework was to remove the arbitrary negative value given to players when they lost the ball. As we will see later, this has led to offensive players being punished less for losing the ball and, combined with the new time-based approach, actually allows players to be rewarded for unsuccessful actions that are lost in dangerous areas.
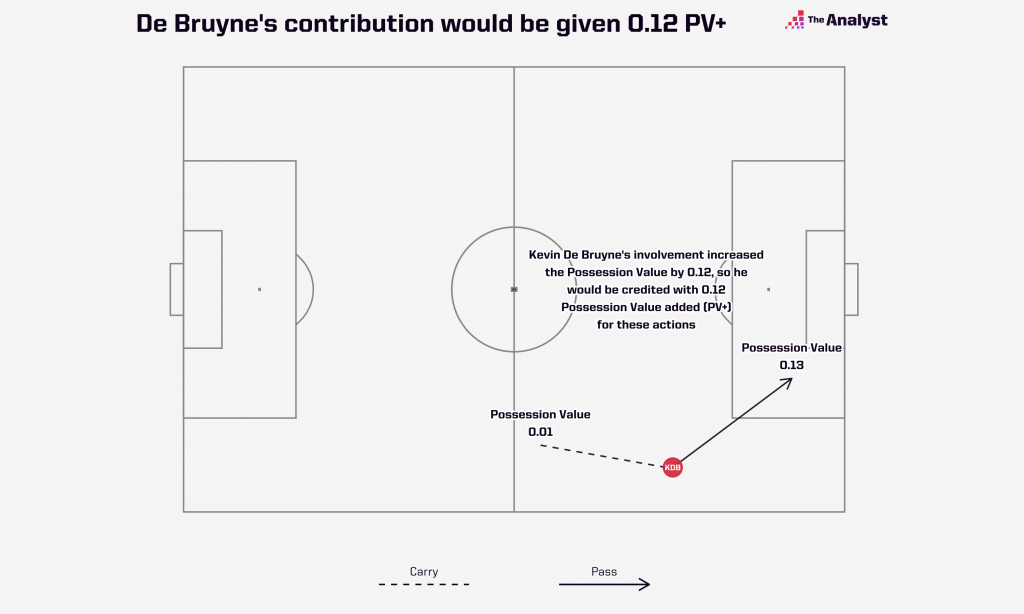
For those that are new to this concept, possession value allows us to value every action on the pitch and see how effective players have been for their team. For example, imagine that Kevin De Bruyne has the ball near the halfway line where the possession value is 1% (PV start = 0.01). If he carries the ball down the line and then plays a pass to Raheem Sterling in the box, where the possession value is now 13% (PV end = 0.13), Kevin De Bruyne has increased the likelihood of his team scoring by 12%. This is what we call possession value added (or PV+) and rewards Kevin De Bruyne for his contribution irrespective of what Sterling chooses to do with the ball next. Manchester City are now 12% more likely to score within the next 10 seconds (PV+ = 0.12).
In this way, it allows us to credit players who may previously have been undervalued by more traditional metrics such as goals and assists. We can look at all of the contributions of an individual player and evaluate whether their positive actions outweigh their negative actions. The fundamental building blocks to calculate a player’s net contribution for their team still remain the same:
- Progressive actions (positive PV+).
- Successful yet regressive actions (negative PV+).
- Loss of possession (the – usually negative – PV+ rewarded for unsuccessful actions).
- Loss of possession leading to direct opponent threat (negative PV+ relative to the danger of the opposition possession)
To see how this looks with the new framework, let’s look at Liverpool’s title-winning team from last season:
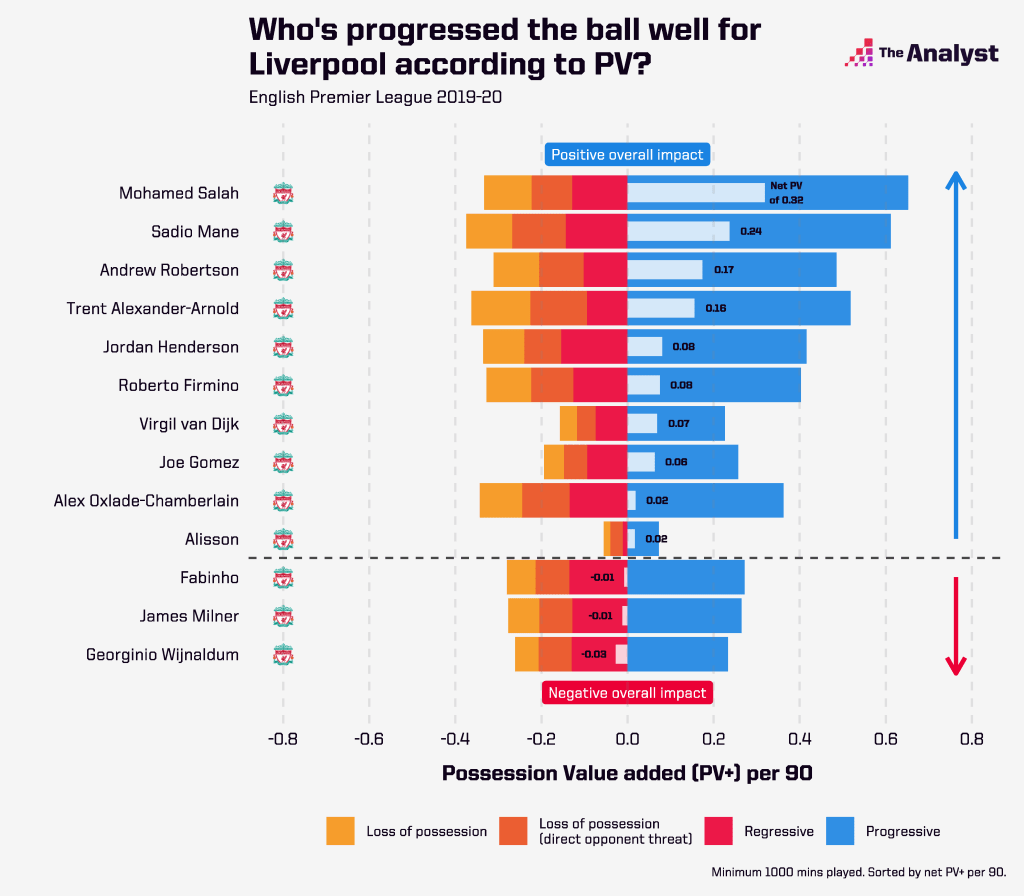
We can see here unsurprisingly that the Liverpool players that are key to increasing the team’s goal-scoring potential come from the wide areas. While forwards Mohamed Salah and Sadio Mané have the greatest net contribution for Liverpool, their full-backs, Trent Alexander-Arnold and Andrew Robertson, aren’t far behind them.
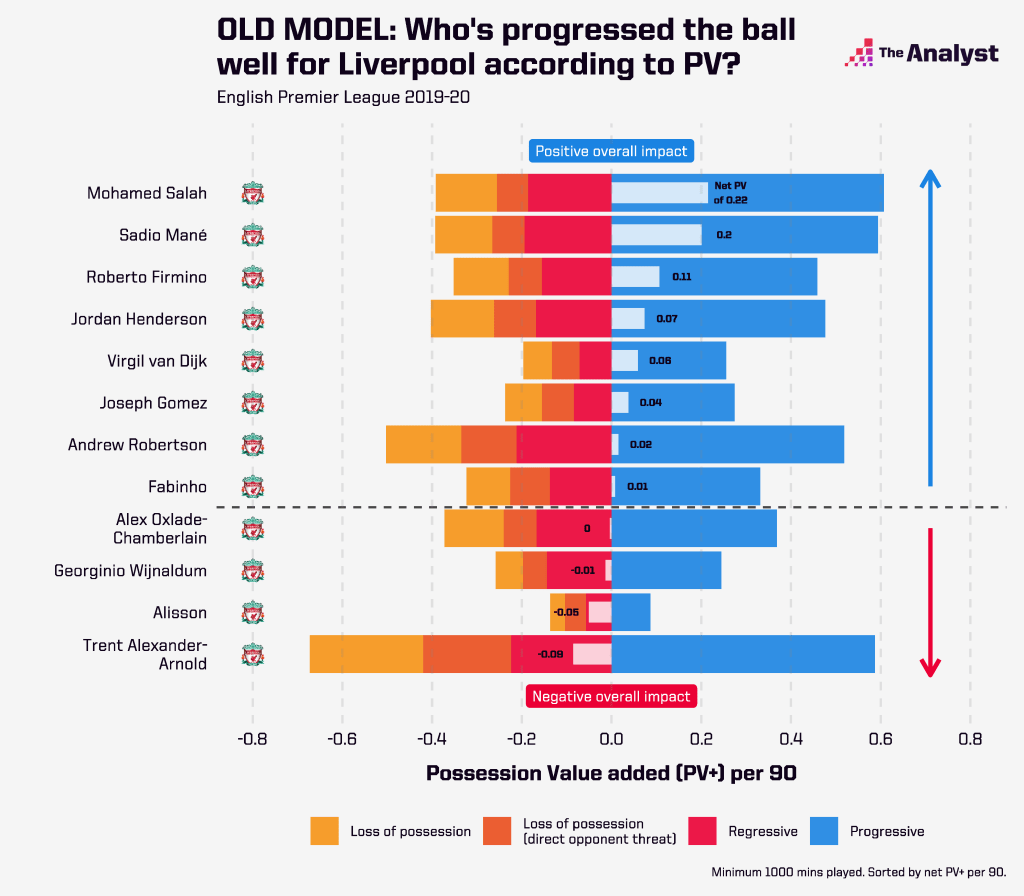
We can see how the new framework differs from the original model above, most notably in Trent Alexander-Arnold’s significant rise in the net contribution rankings. Coupled with the removal of the arbitrary possession loss punishment, another implication of the new time-based approach is that players are now able to receive a positive reward even if they lose possession. This is generally rare but if an attacker won a header in the opposition box, there still could be a chance of scoring in the next 10 seconds, regardless of whether it goes to a teammate or not.
The old framework may have punished full-backs like Alexander-Arnold more for losing possession from his riskier but progressive passing, but these actions may still in fact increase the likelihood of his team scoring. For example, let’s look at this Andrew Robertson cross against Arsenal below:
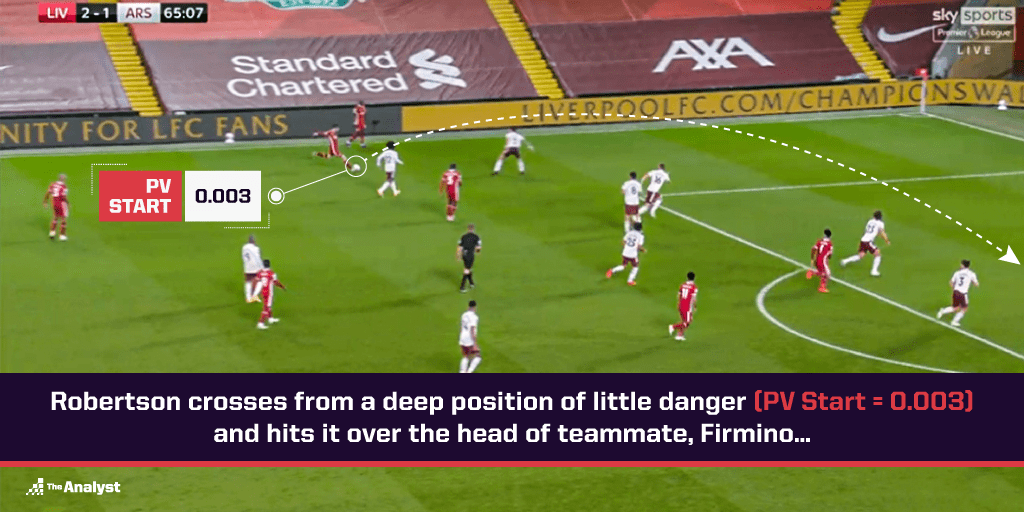
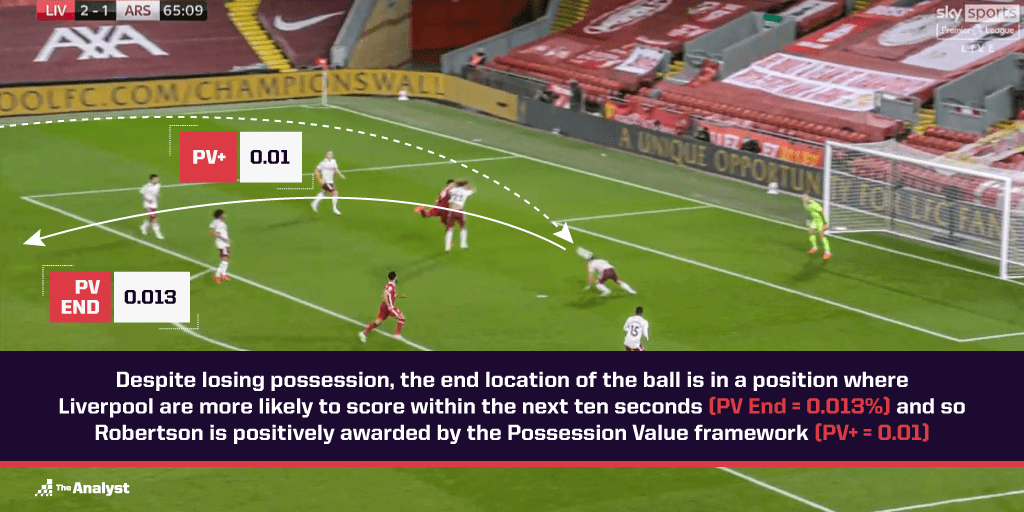
Andrew Robertson crosses from a deep position of little danger (PV start = 0.003) and hits it narrowly over the head of his teammate, Roberto Firmino. The cross was cleared by Kieran Tierney into a central area where Liverpool were actually more likely to score within the next ten seconds (PV end = 0.013) and so Robertson is now positively awarded by the new Possession Value framework (PV+ = 0.01). Andrew Robertson’s cross increased the probability of Liverpool scoring within the next 10 seconds by 1%, despite being unsuccessful in reaching a teammate.
Using this framework, we can also break down player contributions by event type or by game. If we look at the performances of Liverpool’s players against Arsenal on 28th September, we can see who the key players were across the pitch:
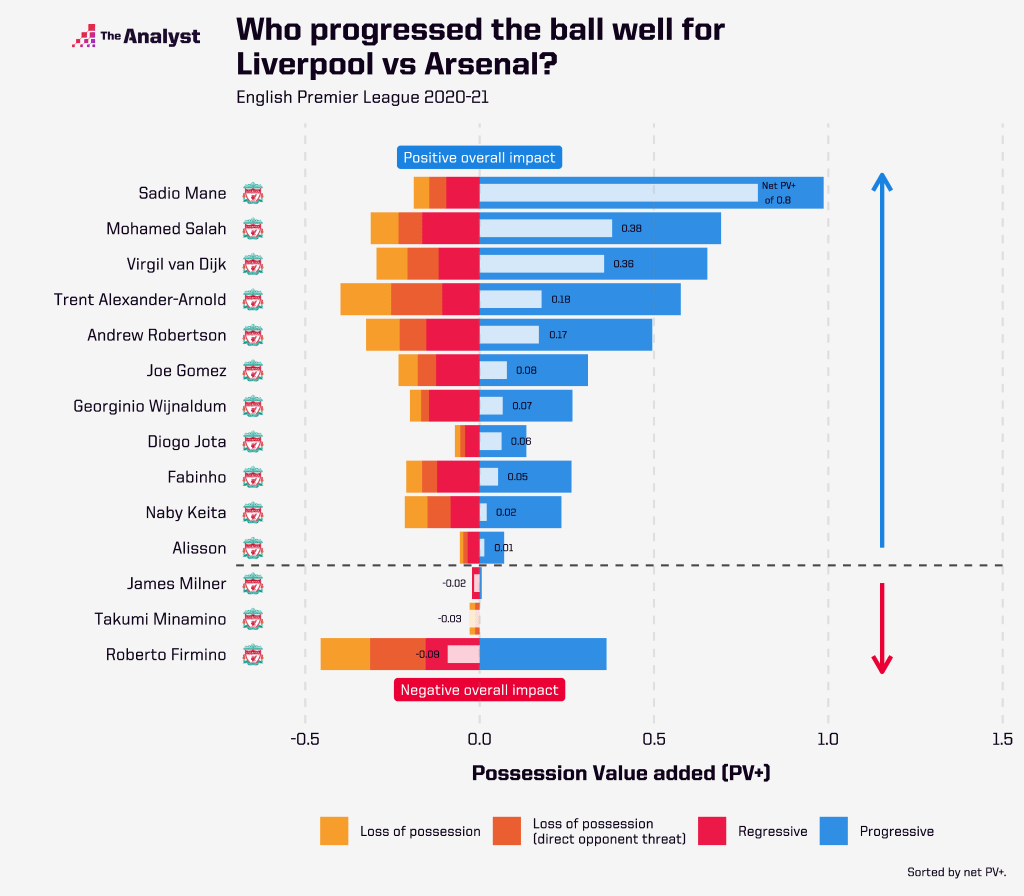
Given Liverpool’s dominance, it is no surprise that nearly all of Liverpool’s starting players recorded positive overall impacts in the game. Notably here, we can see that Virgil van Dijk had the third-highest net Possession Value added for the game (0.36 PV+), rewarding him for his press-evading long balls to Trent Alexander-Arnold and Mohammed Salah on the right hand side. The value of these actions would typically be difficult to credit using other advanced metrics, but we can now see that the combination of van Dijk’s actions during the game led to a net PV+ of 0.36, indicating that Liverpool were expected to score an additional 0.36 goals over the course of the match (compared to if he didn’t take those actions).
It is important to note here that increasing the probability of your team scoring isn’t necessarily the intent of every player, and so ranking lower in net contribution may not be a direct indication of the quality of a player’s performance. The key, as with any metric, is evaluating the output in the context that you’re trying to measure.
Looking at players’ net contributions is just one of many applications of the possession value framework. The framework is a key input to many of the models that we have built into Stats Perform’s Edge Analysis platform. You can see an example of its application below using movement chains in Edge Analysis, allowing us to value the danger level of a team’s patterns of play:
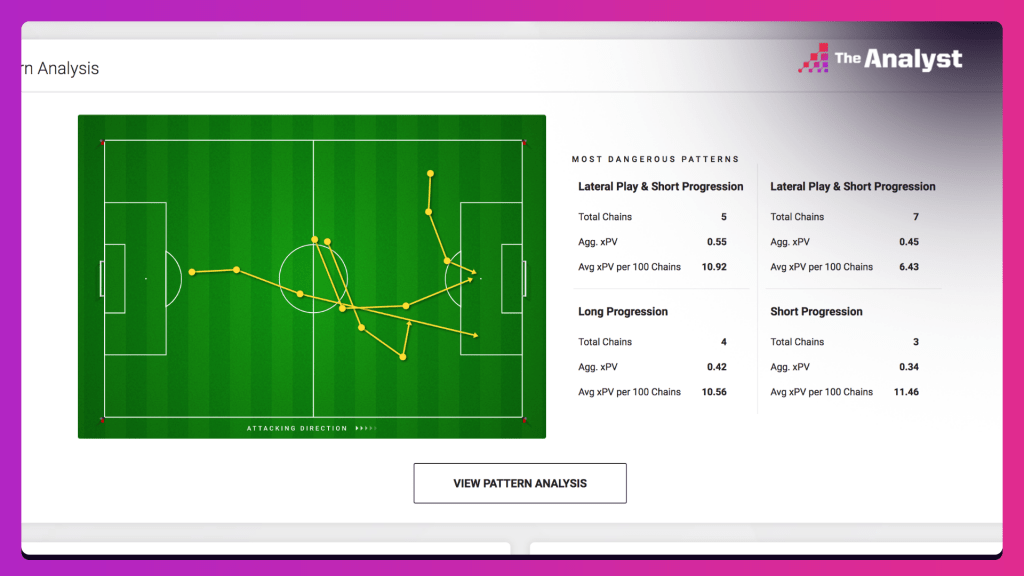
We will talk about this concept, alongside many others, in upcoming articles to demonstrate how the time-based possession value approach is not only an excellent tool in isolation but is a fundamental feature that powers a number of our innovative new AI models.