Let’s look into the details of three underperforming teams, use the advanced data to see whether they’ve got realistic shots at second-half playoff runs, then have some fun with a projected postseason bracket.
The San Diego Padres? St. Louis Cardinals? New York Mets?
Really, there are plenty of candidates when it comes to the most disappointing teams of 2023. And with July 4 considered the MLB season’s second checkpoint to assess whether a club is in a position to be either a buyer or seller at the Aug. 1 trade deadline, it’s an appropriate time to see if our model has any of these clubs putting together a second-half surge.
In MLB.com’s first power rankings in April, the star-studded Padres were ranked third and soon to be getting Fernando Tatis Jr. back, the high-priced Mets were fifth after adding Justin Verlander and the defending National League Central champion Cardinals were 10th. But through July 5, the Padres were an immensely disappointing 41-46, the Mets were 40-46 and the Cards were a last-place 35-51 in a woeful division.
Is there any chance these clubs will live up to their potential before the end of the regular season? We can’t really tell you what will happen, but our model can give us an idea of what probably should happen if teams play to their expected form (according to our expected win percentage model).
It estimates how many runs each team would score and allow based on its raw value and converts that into a winning percentage. Raw value+ (RV+) examines how a hitter performs throughout each pitch of an at-bat rather than just the result and raw value- (RV-) does the same for a pitcher.
In our preseason RV team rankings, which weren’t projections but rather a single ranking system calculated using a model that combined each player’s 2022 raw value data and adjusted for 2023 rosters, the Mets ranked fifth in the majors, the Padres were seventh and the Cardinals were 10th.
Now the Mets are in the middle of the pack in 15th, while Padres and Cards have dropped to eighth and 11th, respectively. And though New York’s 10-spot fall is one of the biggest in the majors since the preseason, San Diego and St. Louis haven’t fallen that far.
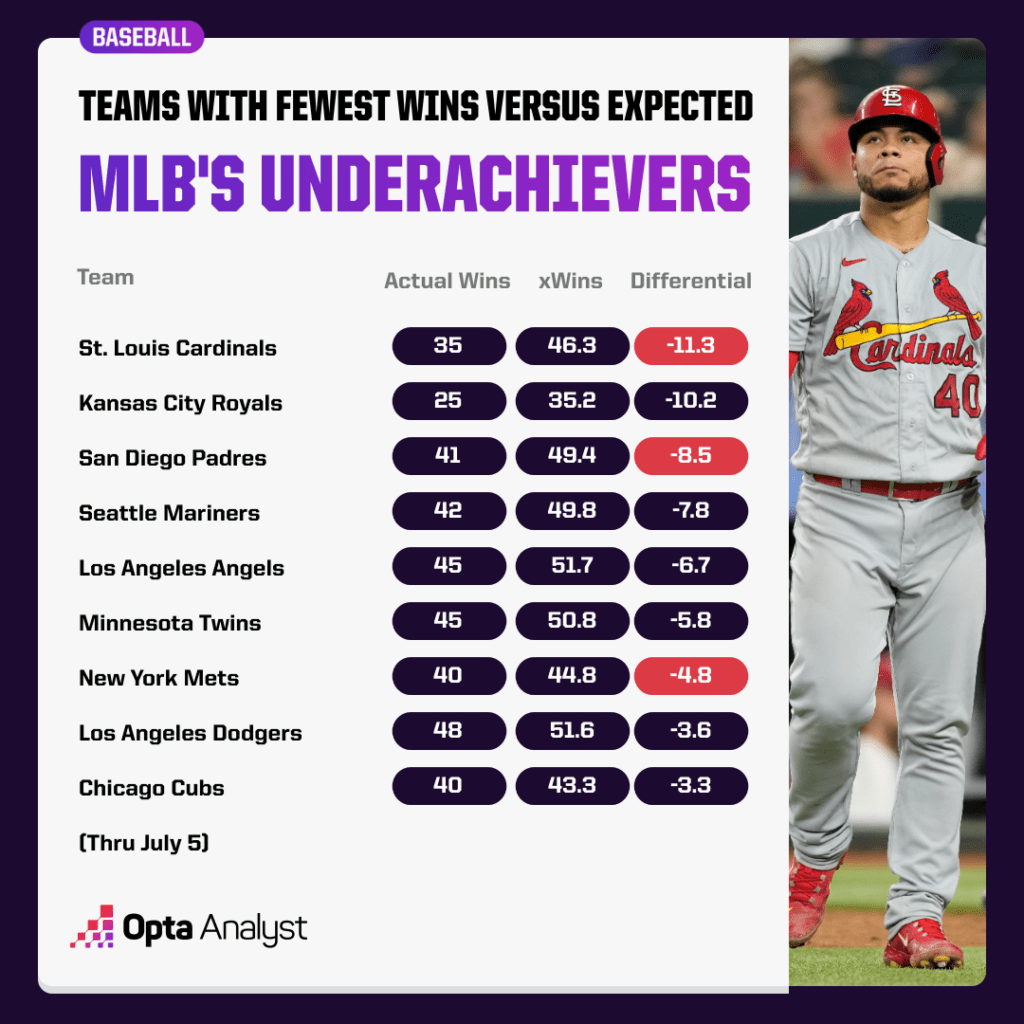
But consider this: The Cardinals and Padres have two of the biggest differentials when it comes to teams with victory totals under their expected wins (per our model), and the Mets have the seventh-largest differential.
The Friars are about eight wins back of their 49-38 expected record, while the Redbirds are around 11 wins behind their expected mark of 46-40.
So if San Diego and St. Louis are both top-11 teams in combined RV, why don’t they have better records? In most cases, it has to do with some combination of bad luck, poor defense at the wrong times and a lack of timely hitting or pitching.
In this case, much of the problem is offensive. The Padres are hitting an MLB-worst .183 in close and late situations and rank fourth-to-last with a .212 average with runners in scoring position and two outs. Close and late situations are those in the seventh inning or later with the batting team ahead by one run, tied or with the tying run on base, at bat or on deck.
The Mets rank 24th in baseball with a .211 average in close and late situations and have the fourth most one-run losses (13-16). The Padres are a league-worst 5-15 in one-run games, while the Cardinals are third from the bottom at 8-18.
St. Louis also ranks 25th in starters RV- (118), has given up the fourth-most hits (96) in baseball with runners in scoring position and two outs and is hitting just .223 with runners in scoring position and two outs – sixth from the bottom.
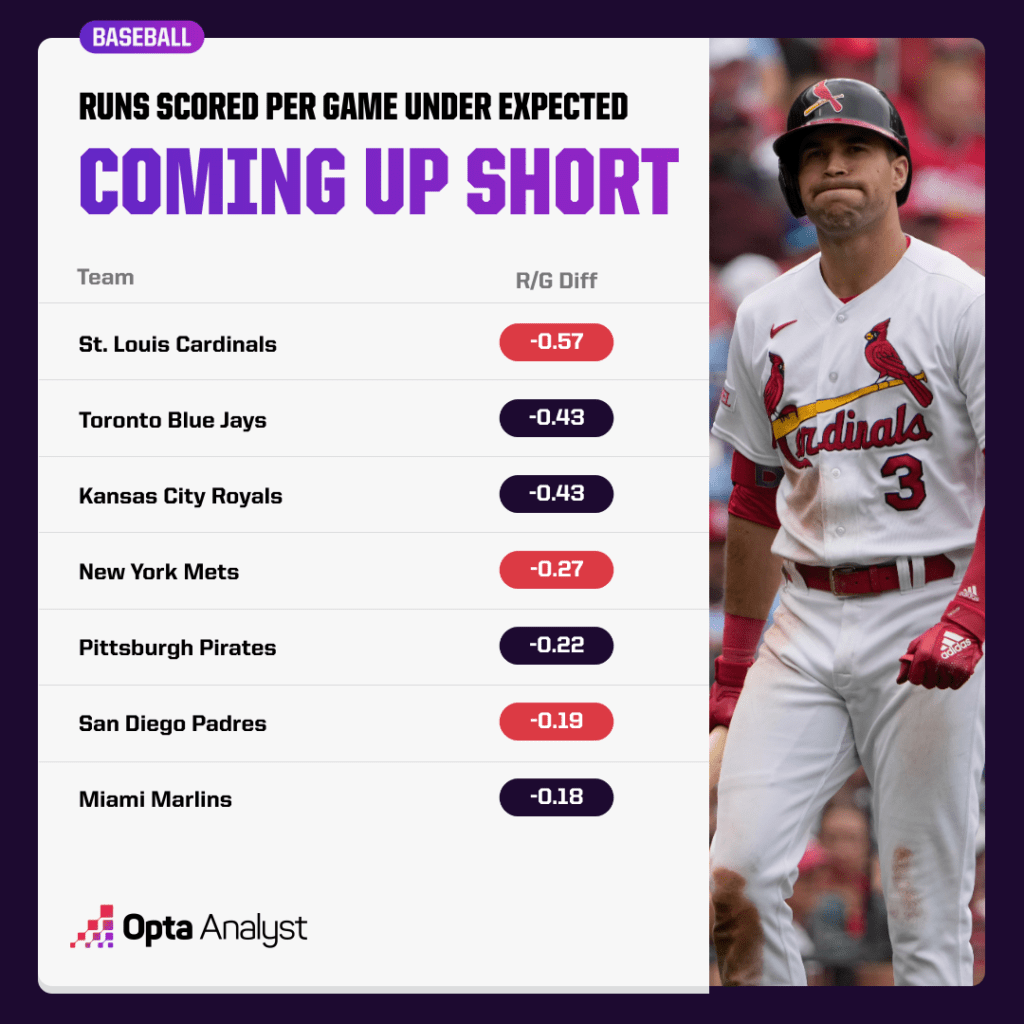
The Cardinals are also averaging an MLB-worst 0.57 runs per game under the expected amount, while the Mets have the fourth-worst mark (-0.27) in the majors and the Padres are sixth from the bottom (-0.19).
Having said all this, there is some regression to the mean that could come into play over the remainder of the season. But will there be enough to lift these teams back into the playoff race? Or will it be too little, too late?
No and yes. Our model does expect these clubs to fare better the rest of the way with the Padres going 43-32, the Cardinals an NL Central-best 41-35 and the Mets 40-36, though it won’t be enough to dig them out of their early holes. It has each of these teams ending up fourth in their divisions.
Using expected winning percentage to calculate the standings over the rest of the season, here’s what the 2023 playoff matchups would look like (all data is through July 5):
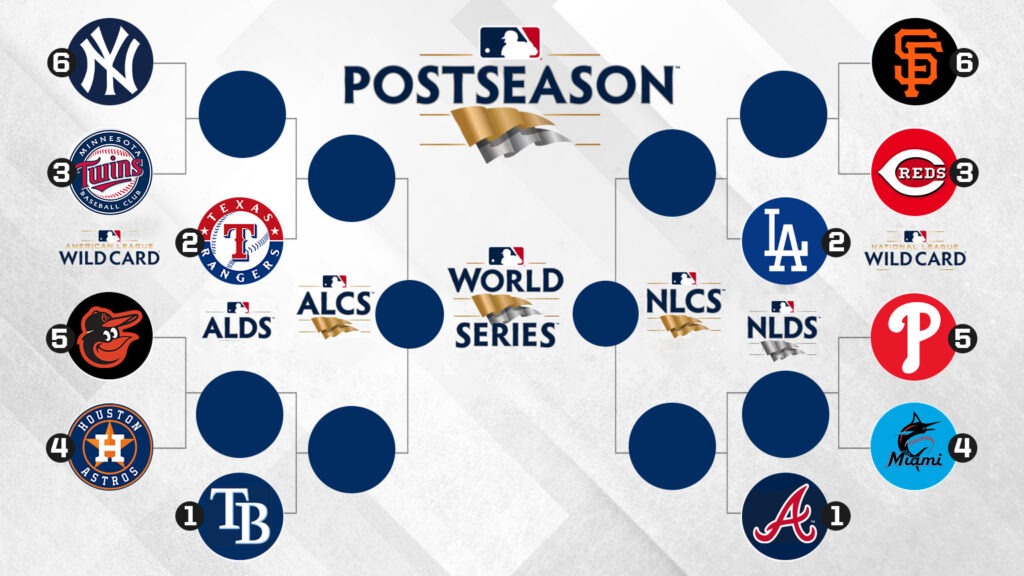
The red-hot Atlanta Braves, who are first in the majors in combined RV (133), are playing only slightly above their league-best expected win percentage of .653 and are set to finish with the best record in the majors at 108-54 if they play to their expected form. They’re followed by the Tampa Bay Rays (98-64), Texas Rangers (96-66), Los Angeles Dodgers (94-68) and the World Series champion Houston Astros (92-70).
Ronald Acuna Jr. would be an easy pick as midseason NL MVP with a league-best 32 total RV, while Matt Olson is ninth in RV and third with a 189 BIP+ (measures damage done upon contact with the league average being 100).
After another slow start, the Philadelphia Phillies are making a postseason push in the NL East similar to last year. They have the second-best record in baseball since June 3 at 21-7 – behind only the previously mentioned Braves (25-4) – and are second in the majors in RV- (85) by starting pitchers.
Zack Wheeler and Aaron Nola lead the way again, ranking fifth and sixth, respectively, in RV-. If the Phils continue their current RV production, our model puts them at 88-74 and two games back of the Miami Marlins (90-72) as a fifth-seeded wild-card team.
The Cincinnati Reds have won 20 of their last 24 games, but they’re 24th in MLB in total RV and are playing well above their .431 expected winning percentage. In fact, the NL Central leaders have a .121 win percentage differential that’s the highest in all of baseball and are bound to be facing some regression,
Our model has the Reds (80.3 expected wins) edging out the Chicago Cubs (79.6) and Milwaukee Brewers (78.6) to win this sad division and become the first champ in big-league history to finish with a losing record at 80-82. The 2005 Padres hold the mark for the worst record by a division winner of a 162-game season at 82-80.
In MLB’s other lackluster division, the Minnesota Twins lead the majors in starters RV- (78) with Joe Ryan first (50) and Pablo Lopez fourth (66). Minnesota owns a two-game lead in the AL Central, which should only grow as the club has six fewer wins than its expected amount. Our model has the Twins finishing 88-74 as easily the best team out of the Cleveland Guardians (72-90), Detroit Tigers (70-92), Chicago White Sox (68-94) and Kansas City Royals (55-107) if they continue their current RV production.
It’s quite a different story in the AL East, where every team could finish above .500. That has never happened before, regardless of the number of teams in the division. Here’s our order of finish: the American League-best Rays, Baltimore Orioles 88-74, New York Yankees 87-75, Toronto Blue Jays 85-77 and Boston Red Sox 82-80.
It’s interesting that the Seattle Mariners have the third-worst differential in terms of actual wins compared to expected wins since they’re another finalist for the most disappointing club of 2023. And while it makes sense that the model sees the Royals as better than their atrocious 25-62 record, it’s eye-opening that the Oakland Athletics are right about where they should be in the AL West at 25-63 based on their RV performance.
The A’s easily have the worst RV in MLB at 56 (the Colorado Rockies are 29th at 74), but will they finish with the worst record of the modern era? Our model doesn’t see it, as their expected 47-115 record would tie the 2018 Orioles for the 15th-worst mark since 1901.
Like this? Follow us on Twitter for more.