
We’ve dug into TRACR quite a bit when it comes to college football and basketball, but we also have the model for NBA, MLB and NFL.
What makes TRACR (Team Rating Adjusted for Competition and Roster) equally important for those leagues?
Because it normalizes a team’s performance (for any sport) from league environmental factors that can either inflate or deflate its numbers.
That’s done with a model that uses advanced metrics and other factors to calculate how many points per 100 possessions (for basketball) or how many runs per nine innings (for baseball) or how many points per 10 drives (for football) better or worse teams are or were compared to the league-average club during a given season.
From this model, we’re able to create an offensive TRACR (O-TRACR), defensive TRACR (D-TRACR) and an overall TRACR. Note that lower is better for defensive ratings in each sport.
As an example, the 1995-96 Chicago Bulls, who set a league record at the time by going 72-10 before winning it all behind Michael Jordan, Scottie Pippen and Dennis Rodman, have the top adjusted team ratings we’ve recorded in the NBA since the 1986-87 season at 14.14.
Here’s what the final 2023-24 NBA regular season TRACR standings looked like:
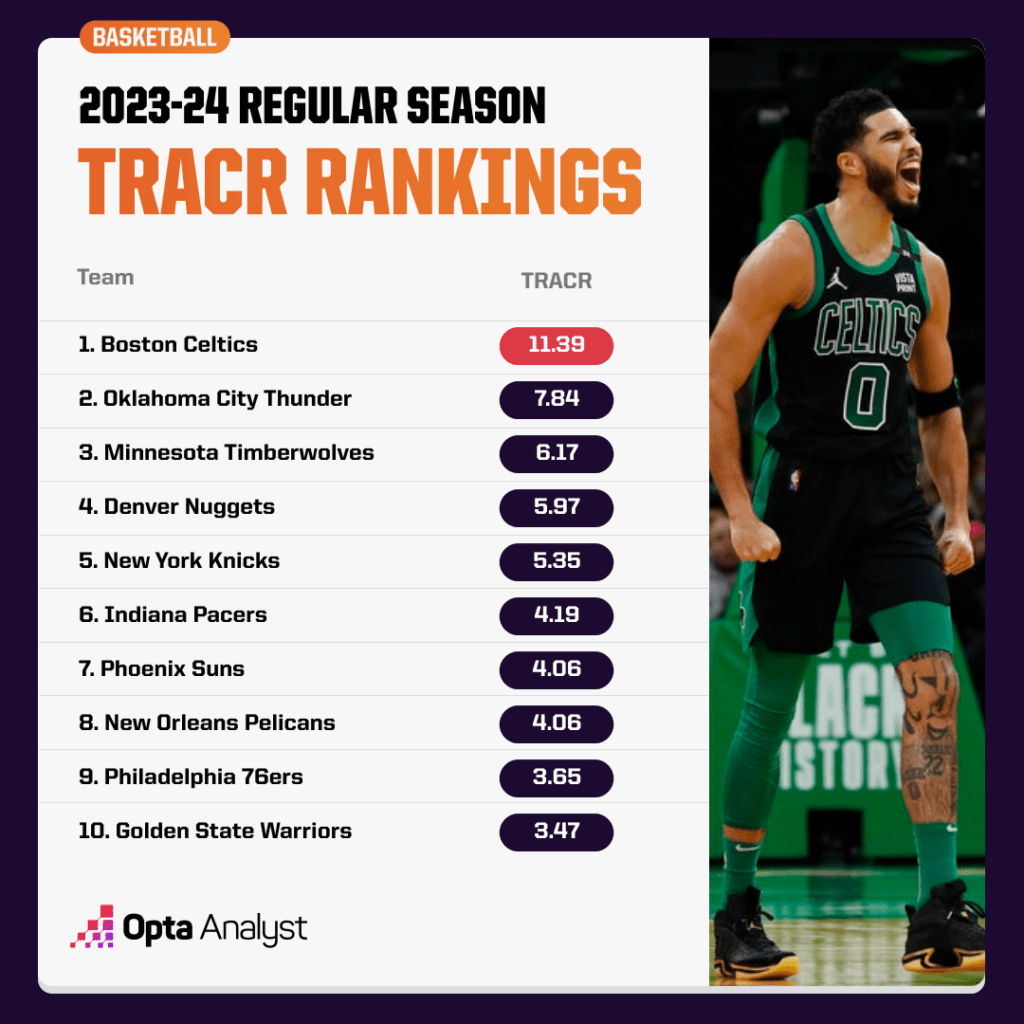
So the Celtics, who finished 64-18 to earn the No. 1 seed in the Eastern Conference, ended up 11.39 points per 100 possessions better than the league-average club during the 2023-24 season. That was far ahead of the West-best Timberwolves at 7.84.
Keep in mind that the model is backward-facing, so it’s based on how well a team has played and not necessarily how well a team will play.
Data modeling by Matt Scott.