
For many, college football is one of the most thrilling sports to watch, especially when your alma mater is doing well, when there are exciting teams playing each other, or when it is a Tuesday and you just want to watch some football.
It can also be the most heartbreaking sports – one bad game could kick a team out of the College Football Playoff or a New Year’s 6 bowl game.
But the essence of college football stems from the wild side, its high variance in which anything could happen. Sure, we know that teams like Alabama and Ohio State will be good, but who will be the best?
Will anyone knock off this season’s top teams? With the Big 12 growing and the Pac-12 crumbling, there are even more questions to consider for this season and beyond.
Thank goodness we have an all-encompassing metric that weighs every team based on their true talent called TRACR (Team Rating Adjusted for Competition and Roster). It’s a net efficiency metric that looks at how good a team is at every play relative to how good its opponent is. The accumulation of that gives us an offensive rating and a defensive rating – the difference between those gives us a team rating.
A team with a TRACR of 0.0 is considered an average team in the FBS. Let’s say the team closest to 0.0 in TRACR is Indiana (-0.1). A team with a positive TRACR indicates that they would outscore an average team (like Indiana) by that many points.
Let”s say TCU is 11th in the FBS with a TRACR of 14.1. If Indiana and TCU played each other at a neutral site, the most likely outcome would be TCU winning by about 14 points.
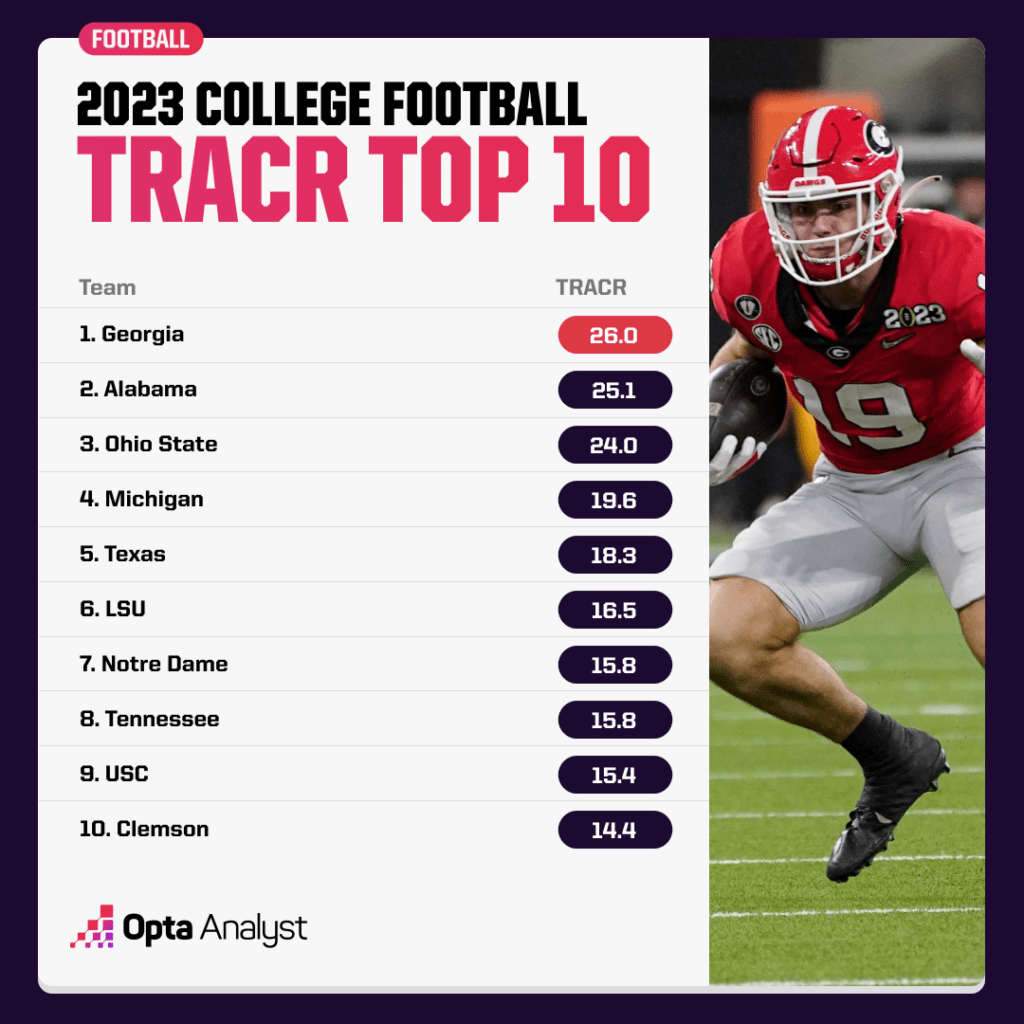
As an example, below was the model’s first top 10 for the 2023 season. The rankings, along with each team’s projected record and probability of winning out and becoming bowl eligible, are updated throughout the season in our FBS Stats Zone.
There were some changes made to TRACR since the end of the 2022 season. The new methodology better captures a team’s true talent because it now can examine every single play a team makes. By doing this, we can see how good a team is in the running game, passing game, special teams and other situations on both sides of the field.
It wraps around the idea of Expected Points Added (EPA) – you may have heard of this concept in the NFL. The idea is a better way to understand how important individual plays are. We want to know how many points a team is more likely to get on a drive based on the result of that play.
To get EPA, we must find the expected number of points in a single play. Each play will result in a new down, a new time on the clock, or even a possession change. For the new down, yards to go, yards from the end zone, etc., we modeled an expected points value for that team. This model is trained on years of college football data and can accurately determine the chances of each drive resulting in a certain outcome.
For example, suppose a team is at its opponent’s 46-yard line and it’s first-and-10 with about 14 minutes to go in the fourth quarter. We can calculate the probabilities that could occur at the conclusion of the drive.
The results may be the following:
- Chances of scoring a touchdown: 23%
- Chances of deciding to kick a field goal and making it: 7%
- Chances of punting: 50%
- Chances of anything else happening, like a turnover, missed field goal, maybe even an incredibly bizarre safety: 20%
We can find the number of points associated with these outcomes – touchdown is six points, field goal is three, and everything else is zero (a safety would be so unlikely in this example that I am ignoring the possible -2 here). Then, we simply take the expected value, or we sum up these probabilities, multiplied by their outcome value:
- 0.23 6 + 0.07 3 + 0.5 0 + 0.2 0 = 1.59.
Thus, 1.59 is the expected number of points a team would get out of this drive based on their current situation.
Now suppose that a team in the same scenario above rushes the ball for 21 yards. Now it is at the opponent’s 25-yard line with a new set of downs and not that much time off the clock. The chances of scoring will obviously increase to something that may look like this:
- Chances of scoring a touchdown: 35%
- Chances of deciding to kick a field goal and making it: 54%
- Chances of choosing to punt: 3%
- Chances of anything else happening, like a turnover, missed field goal, maybe even an incredibly bizarre safety: 8%
The expected points out of this scenario are now 3.72 – an expected value above 3.0 suggests that a team should likely score on this drive, whether it is a touchdown or field goal.
That 21-yard rush increased a team’s expected points from 1.59 to 3.72. The expected points added take the difference of that: 2.13. Thus, that rush increased the team’s expected number of points on the drive by 2.13 points. That’s an important run!
Of course, one play will not accurately assess how good a team is. However, aggregating these plays and adjusting them according to the strength of the opponent throughout the season will produce a close approximation of a team’s true talent level. That is what encompasses our new approach to TRACR.
This approach now helps us see how good each team is in every category.
Like this? Follow us on Twitter for more.