
With the help of our TRACR model, we’ve calculated the probabilities of advancement for the NCAA Tournament Final Four, then analyzed both matchups deeper with insights from AutoStats player tracking data.
The NCAA Tournament rarely fails to produce an unending series of amazing, unexpected results, and this year’s March Madness and Final Four teams are no different.
The UConn Huskies are the headliners, a dominating men’s basketball team that’s attempting to become the first to repeat as NCAA Division I national champion since Florida in 2006 and 2007. On the other end of the spectrum, the Purdue Boilermakers are in the 2024 NCAA Final Four one year after becoming only the second No. 1 seed in tournament history to lose to a No. 16 seed.
Then you have the underdogs. The North Carolina State Wolfpack needed to win five games in five days in the ACC Tournament just to earn an automatic bid into the biggest of the basketball dances; they went from making NIT plans to drawing comparisons to the most magical March in school history (y’know, 1983 national champions). NC State is now one of six 11 seeds in tournament history to reach the Final Four. Additionally, Alabama sure looked like a team that was running out of gas down the stretch, losing four of its final six games heading into Selection Sunday.
Seriously, how much fun are we going to have watching the final three games of the 2023-24 season, set for State Farm Stadium in Glendale, Arizona? Saturday’s winners will meet in the national championship game on Monday.
For March Madness predictions, we’ve utilized TRACR, our Team Rating Adjusted for Conference and Roster. TRACR is a net efficiency metric that calculates a team’s points per possession on both sides of the ball, adjusted by the team it plays. The model rewards teams that do well against good teams and subtracts from those that do poorly against weaker squads. We’ve also been following the tournament with some advanced metrics made possible by our AutoStats computer vision tracking data, which we’ve sprinkled in here to go deeper into each matchup.
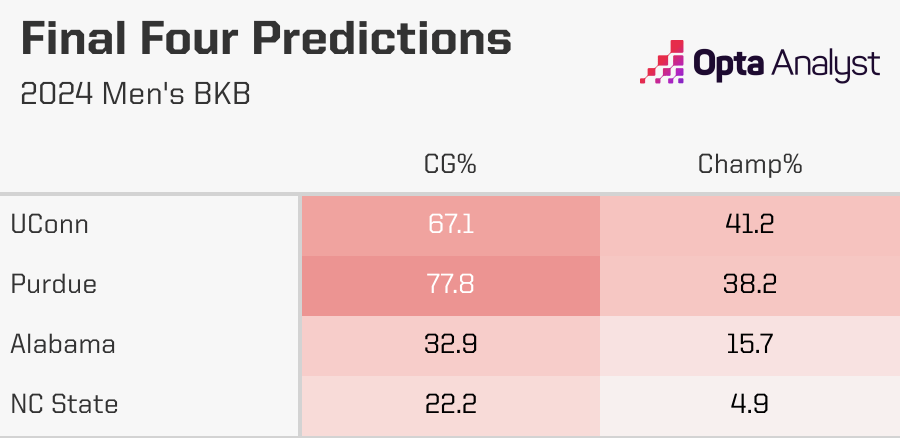
We’ve simulated both the men’s and women’s NCAA college basketball tournaments for the probabilities of advancement and predictions. Purdue may have the best chance of reaching the title game (77.8%), but entering the Final Four, it’s still UConn with the edge for the national title.
Let’s take a look at the stats and storylines we’ll see in the Final Four matchups, and try to make sense of a nonsensical few weeks of NCAA Tournament basketball.
No. 11 Seed NC State (26-14) vs. No. 1 Seed Purdue (33-4)
Tipoff – 6:09 p.m. ET Saturday (TBS, TNT and truTV)
TRACR Rating – NC State: 21.84 (37th in NCAA Division I); Purdue: 38.43 (3rd)
Offense TRACR Rating – NC State: 11.68 (37th); Purdue: 23.58 (1st)
Defense TRACR Rating – NC State: -10.16 (36th); Purdue: -14.85 (10th)
Win Probability – NC State: 22.2%; Purdue: 77.8%
NCAA Tournament Wins – NC State: Texas Tech, 80-67 (first round); Oakland, 79-73 OT (second round); Marquette, 67-58 (Sweet 16); Duke, 76-64 (Elite Eight). Purdue: Grambling State, 78-50 (first round); Utah State, 106-67 (second round); Gonzaga, 80-68 (Sweet 16); Tennessee, 72-66 (Elite Eight)
Coaches – NC State: Kevin Keatts (seventh season); Purdue: Matt Painter (19th season)
3 Key Players – NC State: DJ Burns Jr., 6-9 forward (13.0 ppg, 4.1 rpg, 2.8 apg); D.J. Horne, 6-1 guard (16.8 ppg, 2.1 apg, 50 steals); Casey Morsell, 6-3 guard (11.4 ppg, 2.7 rpg, 1.7 apg). Purdue: Zach Edey, 7-4 center (25.0 ppg, 12.2 rpg, 80 blocked shots); Braden Smith, 6-0 guard (12.2 ppg, 5.8 rpg, 7.5 apg); Fletcher Loyer, 6-4 guard (10.6 ppg, 2.1 rpg, 2.0 apg)
What to Know – Has any player become more of a folk legend during this year’s March Madness than DJ Burns Jr.? NC State’s lefty big man put on a clinic against Duke in the Elite Eight, toying with the Blue Devils — to the tune of 29 points on 13-of-19 field-goal shooting — in the way he used to toy with Big South foes when he played his first three seasons at Winthrop. His performance was a perfect next chapter in the Wolfpack’s unbelievable tournament story, but if you’re not a Wolfpack diehard or haven’t seen him play much, you might be wondering what to expect to see from him in the post against Purdue. Well, we’ve been creeping on him with AutoStats.
Among players with at least 900 touches tracked through AutoStats this season who qualified for the NCAA Tournament, Burns had the fourth-lowest ratio of passes to touches at 0.50. If he’s not passing, what does that mean he’s doing? Probably looking to score. However, when he did pass, it very often turned into scoring opportunities. He led all players in the percentage of his passes that led to shots (28.4%), the percentage of his passes that resulted in assist opportunities (29.2%) and the percentage of his passes that resulted in assists (13.8%). Those numbers have stayed pretty steady throughout the tournament, at 0.54 passes per touch, 28.4% leading to shots, a 29.7% assist opportunity and 13.5% resulted in assists.
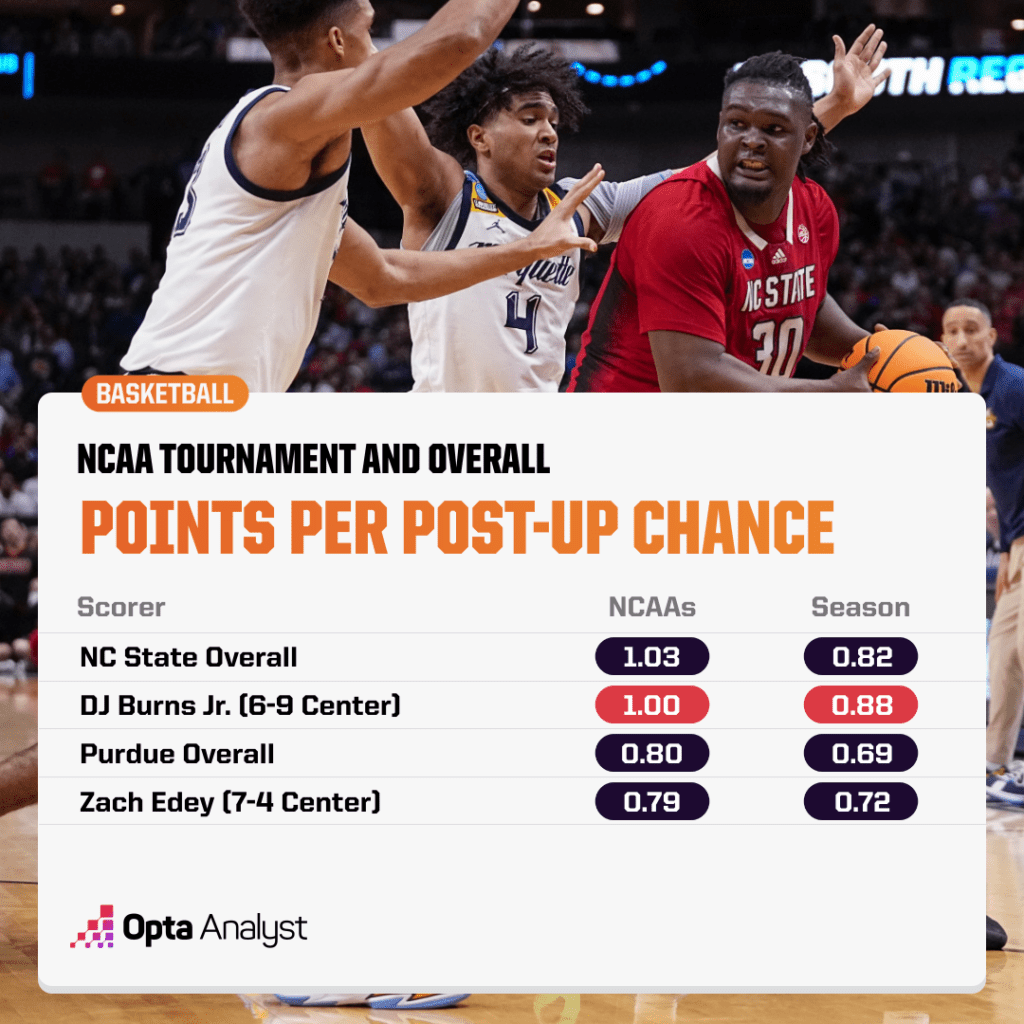
If it seems like analysts and journalists are hung up on the Burns-Zach Edey storyline, it may be for good reason. Burns’ ratio of passes to touches might be low, but Purdue big man Edey had by far the lowest this season at 0.39 at that 900+ threshold for tourney qualifiers. Edey and Burns have led the tournament in post-ups. Purdue has averaged 0.79 team points per post-up chance on Edey post-ups during the tournament, while NC State has averaged 1.00 team points per post-up chance with Burns.
No kidding, it’s still hard to believe NC State is playing in the Final Four. This sounds almost sacrilegious, but if this NC State team wins the title, it will be an even bigger shock than when coach Jim Valvano’s 1983 Wolfpack ended an improbable run by upsetting Houston.
Speaking of stories, Purdue’s run through the tournament has been an almost unbelievable redemption tour, and it feels familiar. It wasn’t that long ago Virginia was a No. 1 seed that lost to a 16, then came back the next year to win the national title. If Purdue turns that same trick this time around … that can’t happen twice, can it? And for all his success on the basketball court in his historic Purdue career, Edey sure had a bunch of folks who didn’t believe in him, didn’t he? That’s why his performance in the Elite Eight against Tennessee — 40 points and 16 rebounds in 39 minutes — was easily the most cathartic performance of March Madness.
It also reflects on Purdue’s high passing efficiency during the NCAA Tournament, keeping with a season-long theme. Among teams to reach at least the Sweet 16, the Boilermakers rank first in assist percentage (11.37) and secondary assist percentage (4.65) as well as second to Alabama in assist opportunity percentage (21.96), according to AutoStats.
No doubt, compelling storylines meet in this Final Four matchup. On paper, the Big Ten regular-season champion Boilermakers should win this one rather easily — check out the gap in the TRACR ratings and the win probability listed above — but not everything about this tournament has gone according to the “on paper” thread of logic or predictions. Buckle up.
No. 4 Seed Alabama (25-11) vs. No. 1 Seed UConn (35-3)
Tipoff – 8:49 p.m. ET Saturday (TBS, TNT and truTV)
TRACR Rating – Alabama: 30.17 (ninth in NCAA Division I); UConn: 43.05 (first)
Offense Rating – Alabama: 23.44 (second); UConn: 23.03 (third)
Defense Rating – Alabama: -6.73 (78th); UConn: -20.01 (third)
Win Probability – Alabama: 32.9%; UConn: 67.1%
NCAA Tournament Wins – Alabama: Charleston, 109-96 (first round); Grand Canyon, 72-61 (second round); North Carolina, 89-87 (Sweet 16); Clemson, 89-82 (Elite Eight). UConn: Stetson, 91-52 (first round); Northwestern, 75-58 (second round); San Diego State, 82-52 (Sweet 16); Illinois, 77-52 (Elite Eight)
Coaches – Alabama: Nate Oats (fifth season); UConn: Dan Hurley (sixth season)
3 Key Players – Alabama: Mark Sears, 6-1 guard (21.5 ppg, 4.2 rpg, 4.0 apg); Aaron Estrada, 6-3 guard (13.3 ppg, 5.5 rpg, 4.6 apg); Rylen Griffen, 6-6 guard (11.3 ppg, 3.5 rpg, 1.9 apg). UConn: Tristen Newton, 6-5 guard (15.0 ppg, 6.7 rpg, 6.1 apg); Cam Spencer, 6-4 guard (14.4 ppg, 4.1 rpg, 3.7 apg); Donovan Clingan, 7-2 center (12.9 ppg, 7.5 rpg, 81 blocked shots)
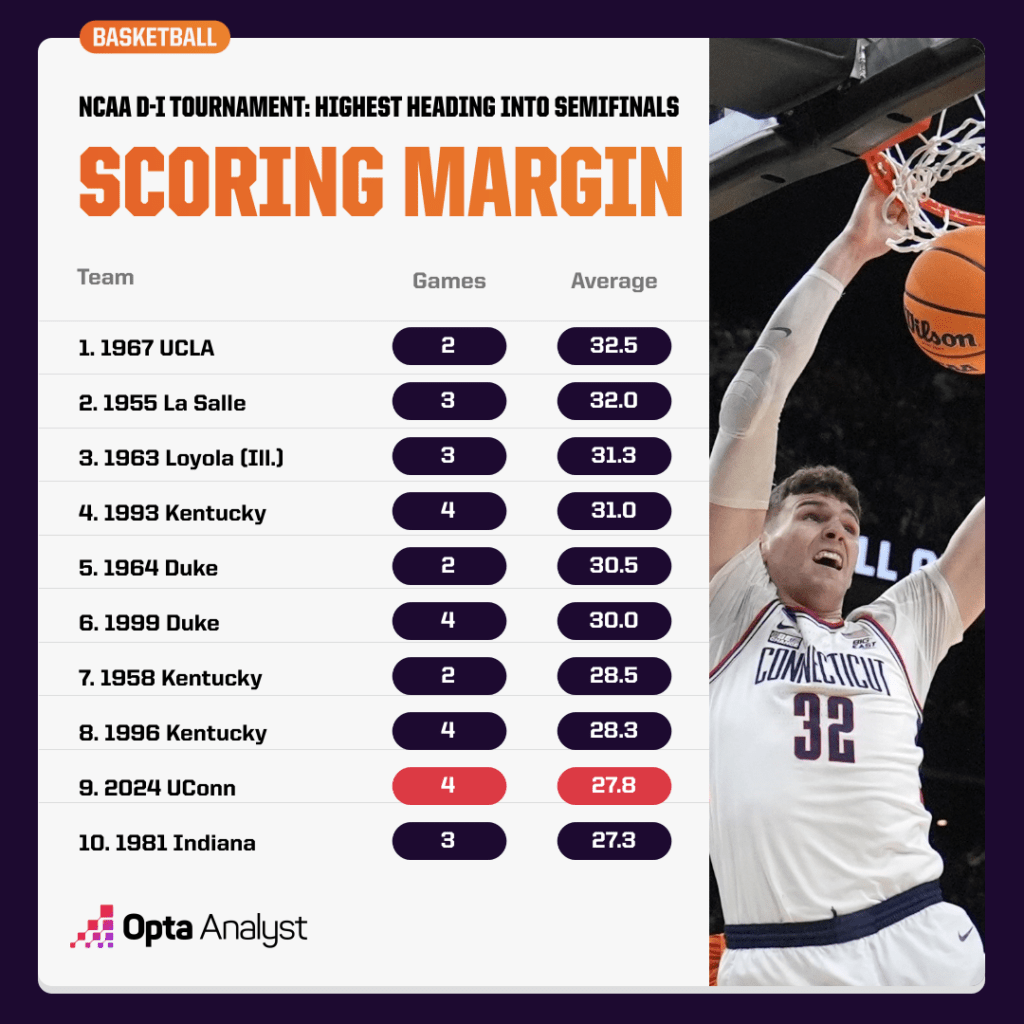
What to Know – Alabama has been playing very well lately, no doubt, but the Tide’s opponent just seems like an absolute steamroller, doesn’t it? UConn has played 10 NCAA Tournament games the past two seasons and won every time by at least 13 points. Last weekend, they won by 30 and 25 to get to the Final Four. That’s bonkers.
And think back to that Elite Eight win over Illinois. At one point, the contest was tied 23-23. The Huskies then scored the next 30 points. Yes, a 30-0 run – UConn dropped in more points during it than Illinois had scored the entire game.
Thirty is an impressive number in that context, but so is zero. How has UConn excelled at the defensive end? Hope you’re ready for some in-depth numbers explaining for how something like that happens.
First, ball screens. The Huskies have allowed only 0.52 points per chance on ball screens during the tournament, the best rate among all teams that made it out of the first round. That would’ve led the NCAA during the regular season. UConn allowed 0.77 team points per chance on ball screens pre-tournament. Donovan Clingan was the screener defender on 36% of those screens during the tournament, and opposing players have averaged only 0.58 team points per chance in those situations, tops among players who have defended at least 50 screens this tournament. Opposing teams scored 0.76 team points per chance with Clingan as the screener defender pre-tournament.
On the other side of the ball, Alabama has averaged 0.93 points per screen chance during the tournament. That’s sixth-highest among the 32 teams that made it out of the first round. This was a significant improvement on the 0.84 team points per screen chance the Crimson Tide averaged pre-tournament. Mark Sears has led the team in ball screens from a ball handler perspective during the tournament, and while he has individually scored 0.4 points per screen (tops among players with 50+ screens), the team overall has only scored 0.75 points per chance on those screens. That the lowest rate among players with 50+ screens. So he has been able to generate offense for himself on his ball screens, but not for his teammates.
Alabama is an elite offensive team, checking in at second in the O-TRACR ratings, but Illinois wasn’t shabby, either, sitting there at sixth in Division I. How can Alabama keep up? Behind Sears and Aaron Estrada, the Crimson Tide run a lot of isolation plays – the fourth-highest rate among all teams in the NCAA Tournament (0.09 per touch), and an increase of their Division I-leading pre-tournament average (0.75). Additionally, Sears is shooting 44.7% on a tourney-high 38 3-point attempts despite nearly three-quarters of them contested by the defense.
Of course, UConn has been particularly tight on defense during its tourney run, as opposing players have made only 16% of their contested 3s. And as for those isos, UConn has allowed 0.64 team points per chance on opponent isos during the tournament. That’s fifth-best among teams that made it to the second round, and an improvement on the 0.81 allowed in pre-tournament games.
Perhaps the alternative is getting to the rim. Sears averaged 0.255 drives per touch, the highest rate among all players with 1,000 touches this season. Estrada ranked fourth, at 0.239. Alabama averaged 0.95 team points per drive chance this season, which ranked third among all tournament teams with a minimum of 500 drives tracked by AutoStats. When Astrada drove, the Tide averaged 0.97 points per chance, which ranked fourth among players with 300+ drives this season, and when Sears drove, they averaged 0.94, which ranked sixth.
Again, two sides to the coin: During the tournament, UConn has allowed only 0.64 team points per chance on drives. That’s second-best among teams that made it to at least the Sweet 16. The Huskies have allowed 0.81 team points per chance on drives overall this season, which ranked 10th-best among all tournament teams. Much of this success came when Hassan Diarra and Stephon Castle defended the drive, as opposing teams only averaged 0.65 and 0.71 points per chance, respectively (third- and fifth-best in the country among players who defended at least 125 drives) when those players were the primary defenders. Those rates have dropped to 0.35 and 0.70 during the tournament.
Most predictions point to the defending national champion winning this semifinal. And after all that talk about UConn’s defense, maybe the biggest thing is the defensive rating of the Crimson Tide: Alabama is 78th in D-TRACR, going up against UConn’s third-rated offense. It’s hard to imagine a world in which the Crimson Tide can come up with the number of defensive stops necessary to slow the Huskies’ march to a second consecutive championship game. Both destiny and defense seem to be siding with UConn.
Enjoy this? Check out our MLB, NBA and NFL coverage, and follow along on X and Instagram for more.