
With the top five European leagues finished for the 2022-23 season, we look back over the key stats trends from the campaign.
The 2022-23 season is now over across the top five European leagues; champions were crowned and the hapless were relegated.
The final positions are what matter at the end of the day, but they’re still only a single small chapter of a wider story, and it’s the rest of the journey that will be even more memorable to many.
Sure, Man City won the Premier League title, and Barcelona were successful in Spain. Bayern Munich won an 11th successive Bundesliga crown, and Napoli ended a 33-year Scudetto wait.
But behind those successes were intriguing statistical trends at play over the 2022-23 season.
Plundersliga
I love goals, goals, goals, goals; goals I do adore. Goals make the (football) world go round – if you ignore Middle East petrodollars – so it makes sense to begin here.
The theme of plentiful goalscoring has been particularly prominent in the Premier League this season, and not only because of Erling Haaland single-handedly sending a load of records tumbling.
There were 1,084 goals scored across England’s top tier this term, breaking the previous record of 1,072 for a 38-game campaign. It was, perhaps unsurprisingly, the most prolific of the top five leagues with respect to the outright total.
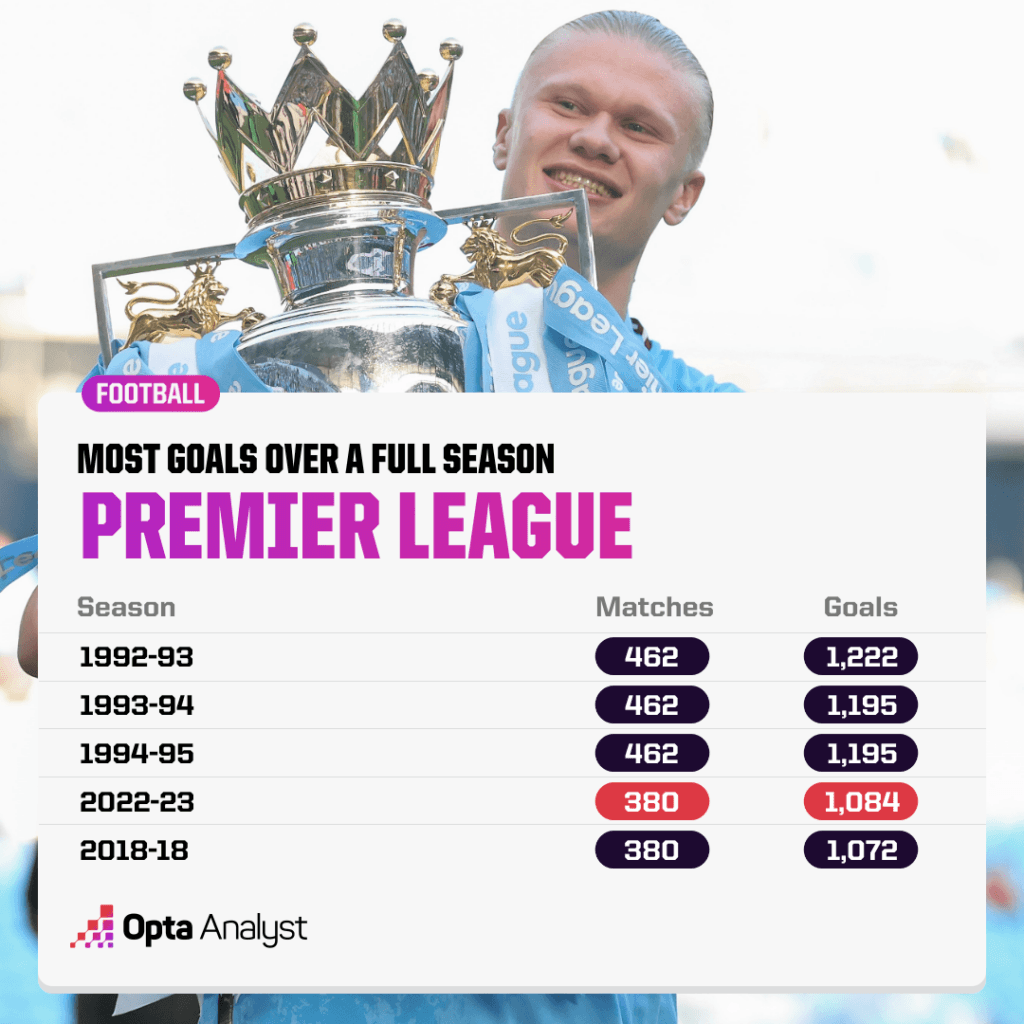
The 2022-23 Premier League season equalled the record for the most games in which seven or more goals were scored (15), while Liverpool’s crushing 9-0 win over Bournemouth back in August had also never been bettered.
And yet, in terms of goals per game, the Premier League (2.85) wasn’t leading the way. No, net bulging was even more frequent in the Bundesliga (3.17). That may not have been a record (3.21 in 2019-20) over the previous 30 years (since the Premier League was founded), but it does continue something of a theme: the top five highest-scoring seasons across Europe’s big five leagues across that period have all been courtesy of Germany.
Eventual champions FC Bayern scored six or more goals five times, including a 7-0 win over Bochum, while Köln also put seven past Werder Bremen in a 7-1 victory in January.
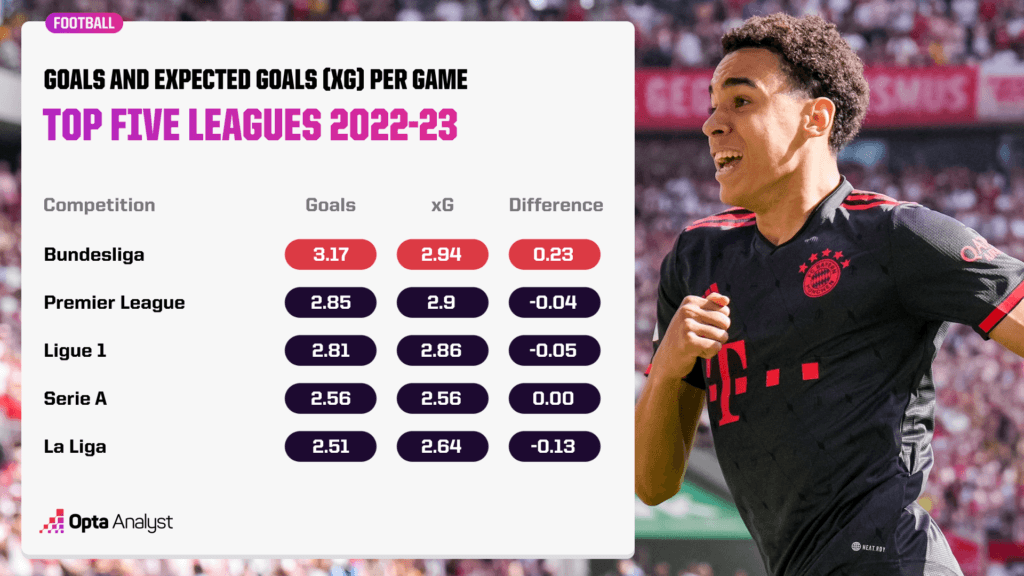
The goals explosion in Germany was made even more notable by the fact the Bundesliga was the only one of the top five leagues to have more goals than expected goals (xG) per game. According to the quality of chances that fell to the 18 teams, there should have only been 2.94 goals each match.
The frequency of 0.38 goals scored outside the box per game could have contributed, considering that was a joint high with the Premier League. Similarly, the Bundesliga’s save percentage of 66.3% was the lowest of the five leagues, and 0.27 errors leading to goals per fixture was the most.
But goals are goals, and for pure entertainment value, it’s difficult to argue against the Bundesliga leading the way this season.
La Liga is ‘Loco’
Goals aren’t the only way to entertain. There can be something truly engrossing about two teams embracing the dark arts and cards being dished out like it’s Christmas.
“Oh, you don’t like to see that,” the commentators say as two players square up to each other, but deep down you’re relishing the prospect of some biff, or the referee going full Antonio Mateu Lahoz.
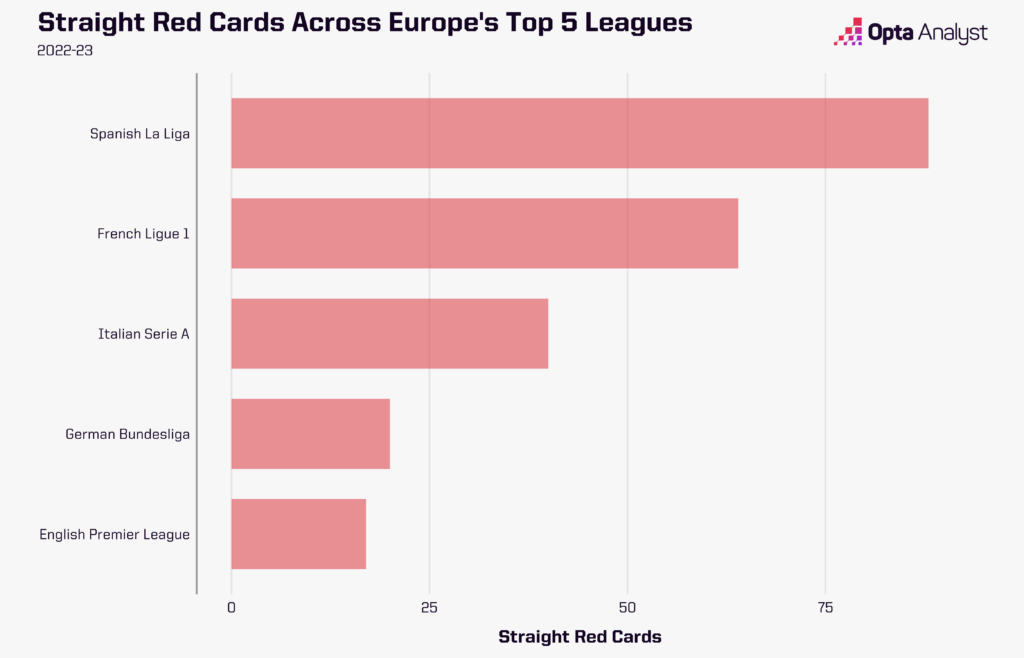
But a problem arises when the football becomes so saturated with indiscipline – or, a perception of indiscipline. Just look at La Liga, which has seen an astonishing number of cards this season.
The season ended with 137 red cards. That’s 107 more than the Premier League, and only four fewer than the top tiers in England (30), Germany (43) and Italy (68) combined (141). La Liga attempted to explain it by suggesting the criteria for red card offences had changed, though didn’t specify how the rules had been altered.
It should be noted that 137 red cards isn’t a record. Going back as far as we have the data (2005-06), figures peaked in 2006-07 (158).
Nevertheless, it’s the most since 2009-10 (149), and the 88 straight red cards in a single season is the most we have on record.
What makes this even more fascinating is fouls per game are at their lowest since at least 2005-06 (25.89), so it’s not really a case of the league becoming more aggressive. No, the explanation probably is down to red card criteria changing – they just seem to have gone too far in the other direction, meaning players are being sent off for offences that would be met with far greater leniency elsewhere.
That’s also trickled down into yellow cards. La Liga referees brandished 1,815 bookings this season at a rate of 4.78 per game. Both figures are highs for the top five leagues, with Ligue 1 the lowest in both totals (1,219) and per game (3.2).
Clearly, something has to change in La Liga.
Playing Styles in Vogue
Throughout football history, different styles of play have been associated more closely with certain countries and leagues. It’s part of the fabric of the sport. But nothing stays the same forever, and some of those perceptions are being challenged now more than ever. La Liga and the Premier League are prime examples.
While Spain was considered the home of ‘Tiki-Taka’ and possession-based tactics earlier this century, the Premier League – once seen as being all about physical prowess – is arguably the benchmark in this sense now.
The Premier League saw 4.29 build-up attacks – open-play sequences comprising 10+ passes and either ending in a shot or at least one touch in the box – each game this season, with it being the only one of the big five leagues to break the 4.0 barrier.
It does come a close second to Ligue 1 in terms of open-play sequences with 10 or more passes per game (20.0 to 19.8), but then there’s a reasonable gap to Serie A in third (17.4). Ligue 1 is also the only one to improve on the Premier League’s average sequence time of 9.25 seconds (9.6s).
But the physicality the Premier League was once renowned for still manages to manifest.
Pressing is probably one of the most fashionable terms in football these days, and it’s very much in vogue as a key element in the tactical repertoires of many of the world’s best managers and head coaches. Of course, a lot of them are in the Premier League.
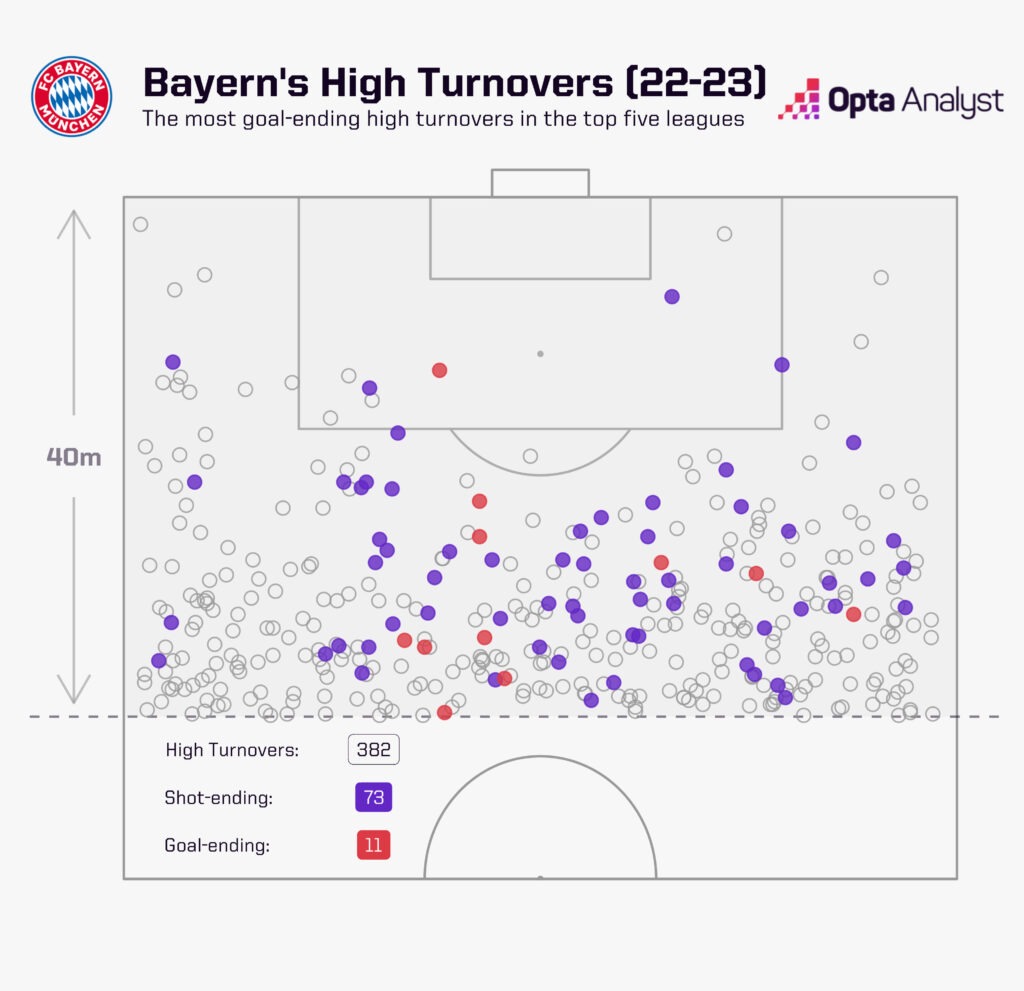
English clubs averaged 16.04 high turnovers each game this season, with Bundesliga teams second on 15.24. Granted, it might seem a little reductive, grouping full leagues together like this. After all, Serie A clubs averaged the fewest high turnovers per game (14.23), yet Napoli (370) ranked fourth of all clubs from the big leagues.
However, it does highlight trends on a wider scale. For example, of the 20 clubs from the top five leagues with the most high turnovers this season, eight are English, six are French, four are Spanish and one is Italian.
The fact the Premier League ranks highly for build-up attacks and direct attacks (second with 3.13) – despite being the slowest league in terms of direct speed upfield this season – highlights the variation and tactical flexibility on display in England these days, whereas the Bundesliga is top for direct attacks (3.31) and bottom for build-up attacks (2.8) per game.
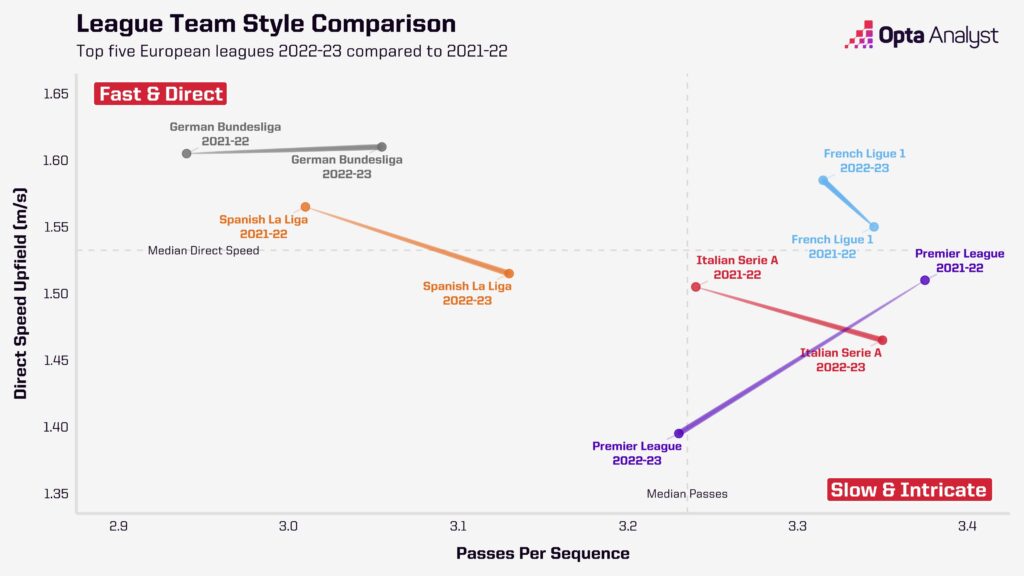
Seemingly, if intense pressing, keep-ball tactics and generally more gradual build-ups are your thing, the Premier League is king.
Building From the Back
Talk of possession feeds in nicely to analysis of goalkeeper distribution, which has certainly been a hot topic in England at times this season with respect to Manchester United and David de Gea.
Many a pundit and fan believe De Gea’s days at Old Trafford should be numbered because he isn’t good enough with the ball at his feet.
Manager Erik ten Hag wants United to play out from the back, but the Spanish goalkeeper often looks uncomfortable in such scenarios.
Of his 735 passes played in his own half, 11.97% failed to reach a teammate. While that may not sound alarming, the Premier League average is 11.02% (goalkeepers with at least 1,000 minutes played). For context, Alisson (5.84%) and Bernd Leno (4.76%) have the best records this season.
United are obviously not the only club who want to play that way, but just how widespread is this strategy?
It might actually surprise you that, among goalkeepers (min. 1,000 mins played) in the Premier League, 51.16% of their total passes were long. The Bundesliga and Serie A both had smaller proportions of passes being played long, with only 47.8% in Germany and 50.5% in Italy.
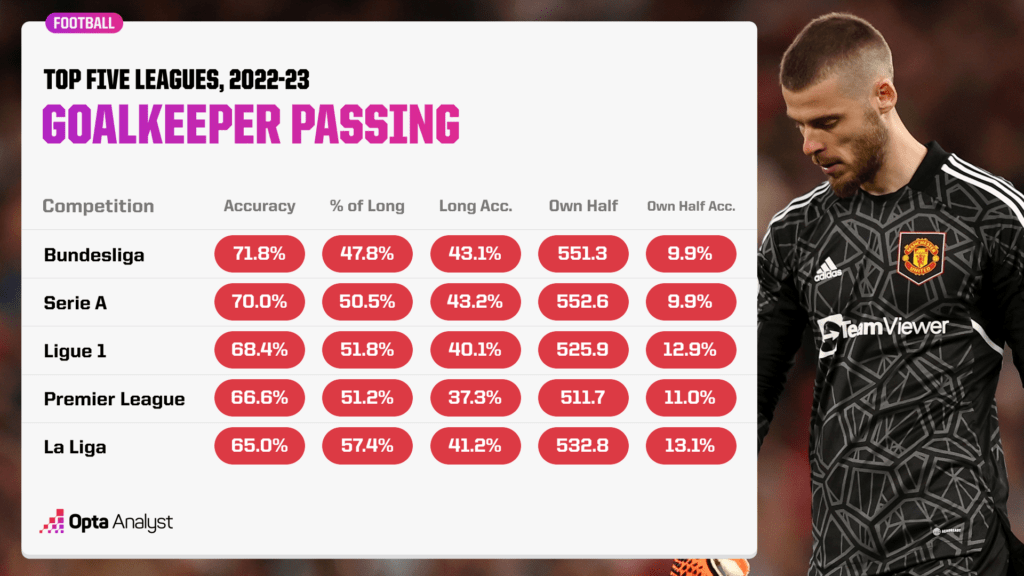
As such, among the same group of ‘keepers, Serie A ranked first for average number of passes in their own half (552.6), and the Bundesliga was a close second (551.3). This translates to a better pass completion rate generally, with the latter at 71.8% and former at 70.0%, compared to, say, the Premier League (66.6%). It of course predominantly leads to fewer wayward passes in the defensive half, with goalkeepers in Germany and Italy only failing to find a teammate in their own half with 9.9% of qualifying passes. As mentioned, the Premier League is 11.02%.
Another potentially surprising outcome is the greater reliance on long passes in La Liga, accounting for 57.4% of all passes by goalkeepers, which is the highest proportion of all the top five leagues. That also led to the biggest share of such passes going astray in the defensive half (13.1%).
How Long Is a Football Match?
If it sounds like a trick question, that’s because it is. You want to say 90 minutes, but technically you’d be wrong.
We caused something of a stir this season when looking into time wasting in the Premier League. It was topical at the time because of how much criticism Newcastle United were getting for disrupting the flow of games.
Multiple opposing managers jumped to similar conclusions. Arsenal boss Mikel Arteta accused Newcastle of wasting time in January; three months later Ten Hag called Eddie Howe’s team “annoying” with respect to apparent attempts to wind down the clock. They weren’t the only two, either.
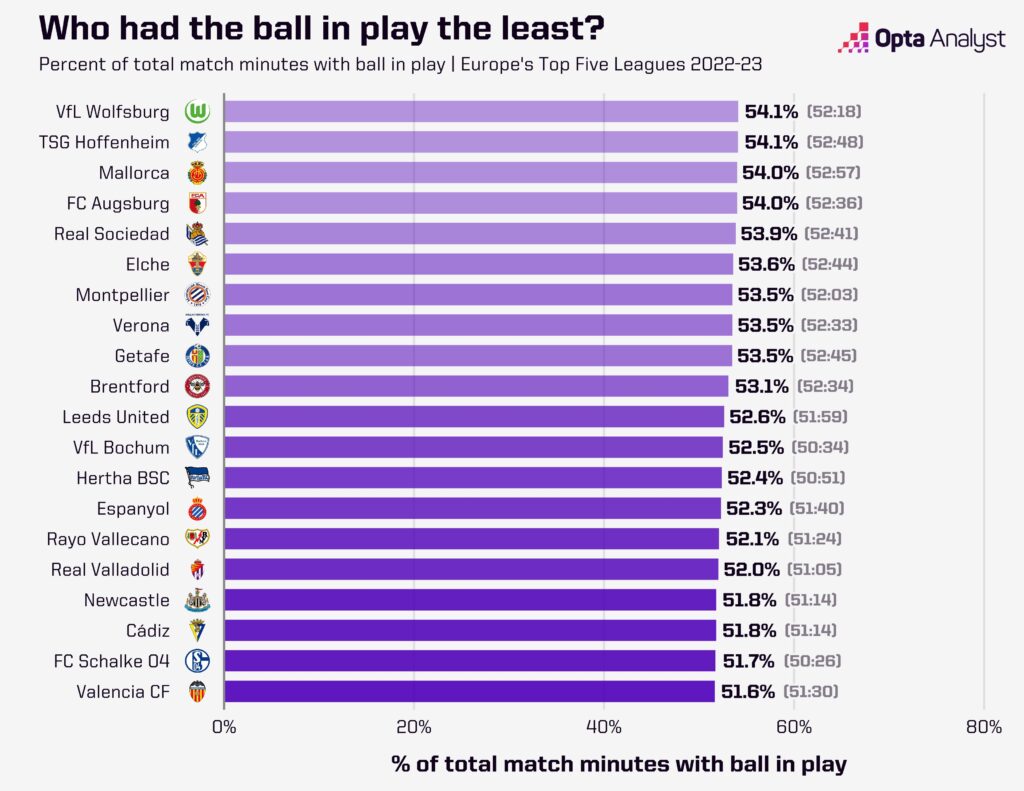
We found that of all 20 Premier League teams in 2022-23, Newcastle’s games had the smallest percentage of total match minutes with the ball in play, and that remained the case at the end of the season (51.8%).
But how do Newcastle and the Premier League in general compare to the rest of the big five leagues?
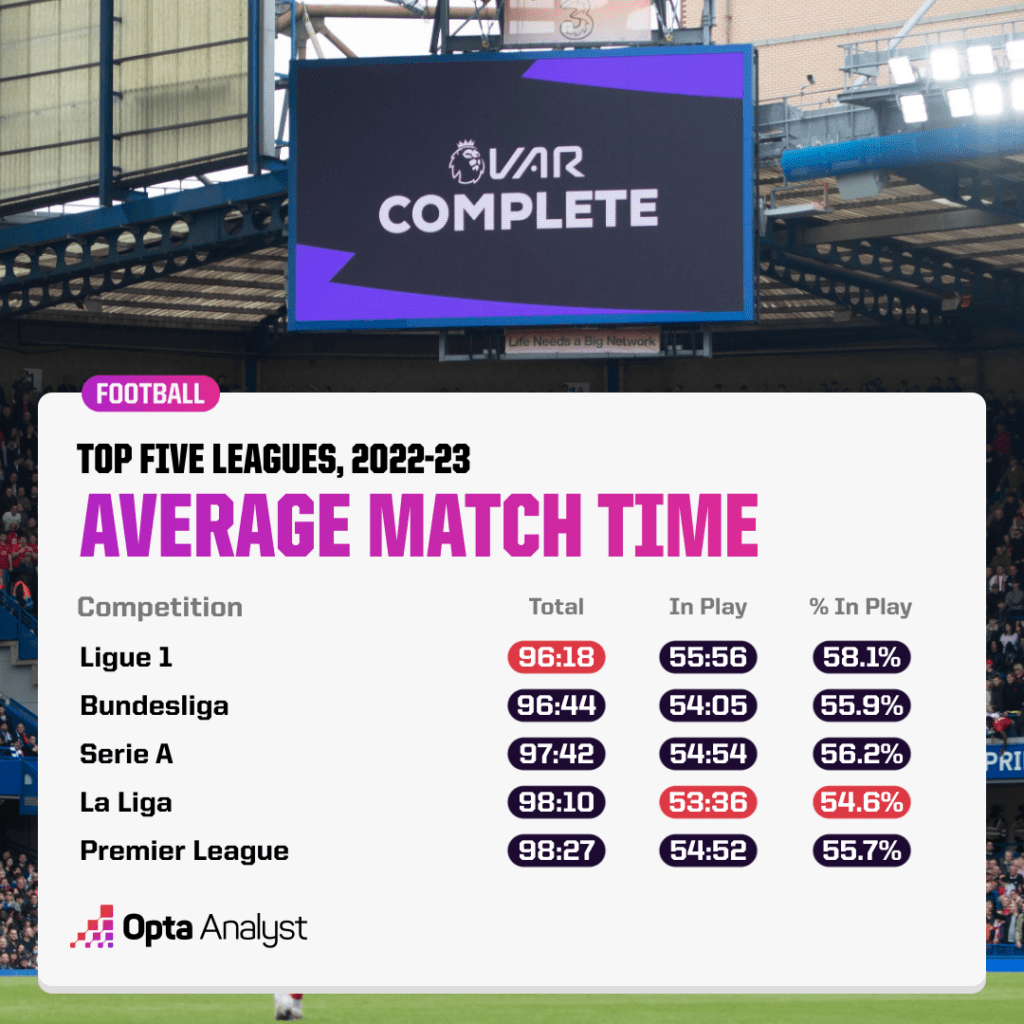
Well, the average total playing time of a Premier League match in 2022-23 was 98 minutes and 27 seconds, which was the longest of the top five leagues. But the ball was in play for only 54:52, shorter than both Ligue 1 (55:56) and – marginally – Serie A (54:54).
When converted into percentages, only La Liga (54.6%) had the ball in play for a smaller proportion of time than the Premier League (55.7%). Ligue 1 was comfortably in front with 58.1%.
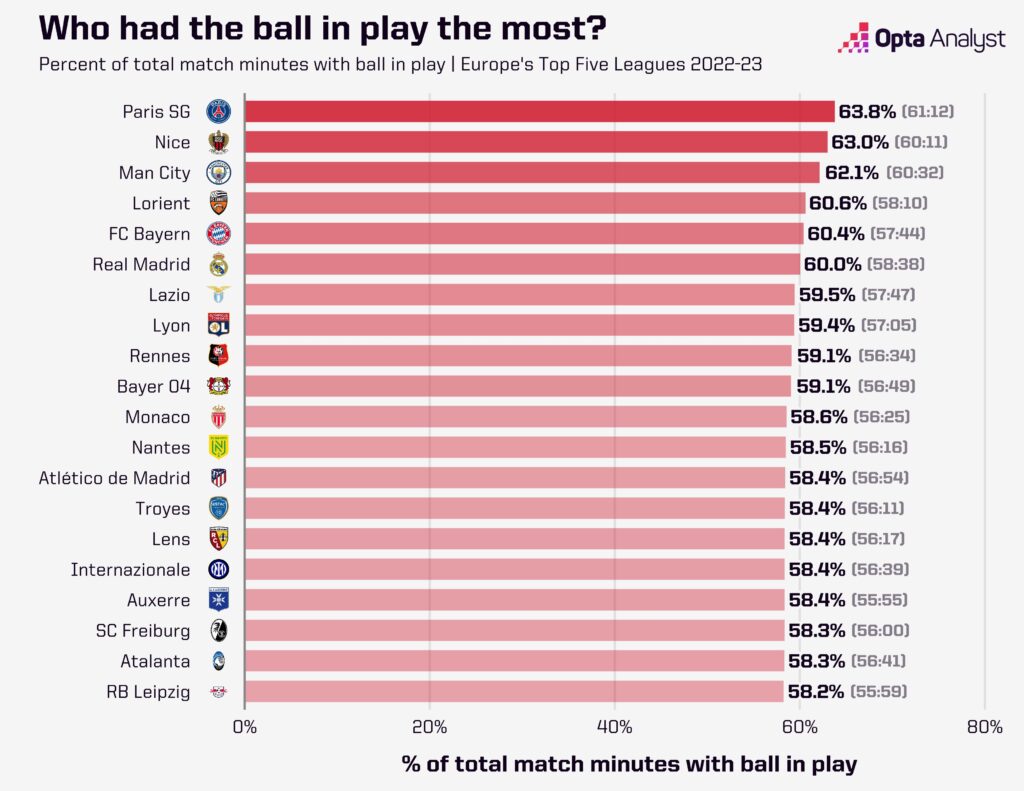
As for Newcastle, only two clubs had poorer records in terms of percent of total match minutes with the ball in play. Cádiz were level with them on 51.8%, while Schalke (51.7%) and Valencia (51.6%) slotted in at the very bottom among all clubs in the top five leagues.
You can’t put it all down to time wasting, but Newcastle’s average of 29.6 seconds per delay – which is the time between the ball going out of play and play being resumed – was the third highest in Europe this season behind Brentford (31.3s) and Everton (29.6s).
However, it’s a problem that goes beyond Newcastle; or Brentford and Everton; or Cádiz and Valencia. No major league in Europe has the ball in play for even 60% of the time and the figures are decreasing – for example, the Premier League’s best season on record in this regard was the 2013-14 campaign (56:43). So, fans are seeing less action for something that continues to cost more to enjoy every season.
Don’t be surprised if this eventually leads to the regulation match time of 90 minutes being reduced.
Enjoy this? Subscribe to our mailing list to receive exclusive weekly content. And follow us on Twitter too.