
It’s a problem in every sport.
The goal of FRACAS has always been to create a player ranking system focused on predicting future performance in golf. And we’ve made changes to the model as we’ve done more research. In the world of player ratings, this is an important task. However, the job of predicting future performance and accurately rewarding past performance are two separate things.
So how should we credit golfers for their performances in tournaments when it comes to predicting future results? The ecosystem of worldwide golf is dependent on qualification. Anyone can theoretically qualify for any tournament by playing well enough, and that is perhaps what makes golf arguably the most relatable professional sports.
But for this to work, we need to have a system that rewards golfers for how they finish in tournaments.
OWGR
The Official World Golf Rankings is the golf world’s qualification system. Let’s say that again: The OWGR is a qualification system. It’s also the governing body of international golf that is used by tournaments and tours to determine which golfers qualify for their tournaments. It is designed to tell the story of player performance in tournaments. It is not designed to be predictive of future performance. This is fine.
The OWGR made a change to its system last fall to try to better distribute ranking points for performance in tournaments. Prior to the change, the field strength of a tournament was dependent on how many players in the top 200 of the OWGR were in the field for that tournament. The results were cyclical, and in order to gain OWGR points you needed to already have OWGR points. There were also minimum point allocation baselines for each tour. These were highly friendly to lower tours as most of the minimums were higher than the actual field strength.
The OWGR changes adjusted the projected points for a tournament to be dependent on the composite strokes gained for the players in the field, called “performance points.” It’s a change we agreed with as it no longer required OWGR points to get OWGR points. There are still issues with some of the tour adjustments, in our opinion, but it’s an improvement over the old model. The change also impacted tournaments with fewer players. Fewer players mean fewer cumulative performance points. Another improvement.
There have been a handful of other attempts to create a ranking system for golfers, most recently by Sports Illustrated with a model that uses strokes per distance to rank players. We’ll just get back to the OWGR.
Where we find issues with the methodology of the OWGR is primarily how points are allocated to finishes. The OWGR relies on a standardized method of allocating points. Approximately 17% of the points allocated to the tournament are given to the winner, 10% to second place, and then an exponential decay down to the last player who makes the cut. In no-cut events, the OWGR traditionally gives points to every player.
While we don’t necessarily agree with giving points to every player who makes the cut, the awarded point numbers are so small that we’re going to effectively ignore them for this project. Where our model differs the most from the OWGR is in two areas: the total number of points given to a tournament and how those points are distributed within the tournament.
Our Ranking System
What does the model do? The model uses simulations to determine the probability of an average PGA Tour player finishing in each position. We are using “average PGA player” both because it is what FRACAS is based on and because the OWGR does something similar.
If we were only looking at a specific tour to create tour points, like R2D points on the DP World Tour, we can adjust “average PGA player” to “average DP World Tour player.”
We take this method because we believe performance should be rewarded based on how hard something is to accomplish. Simulations give us the ability to model out distributions of outcomes, which can take everything about a tournament into account. Field strength, field depth, cut rules, and course all play a role in determining how hard a tournament is to win. These values change from tournament to tournament, and the standardized scale of 17% to first, 10% to second, etc. simply does not fit.
Points are allocated based on the probability of finishing at or above the position being evaluated. For instance, first place would be the probability of winning, second place would be the probability of finishing second and the probability of winning, third place would be the probability of finishing first, second, or third, and so on.
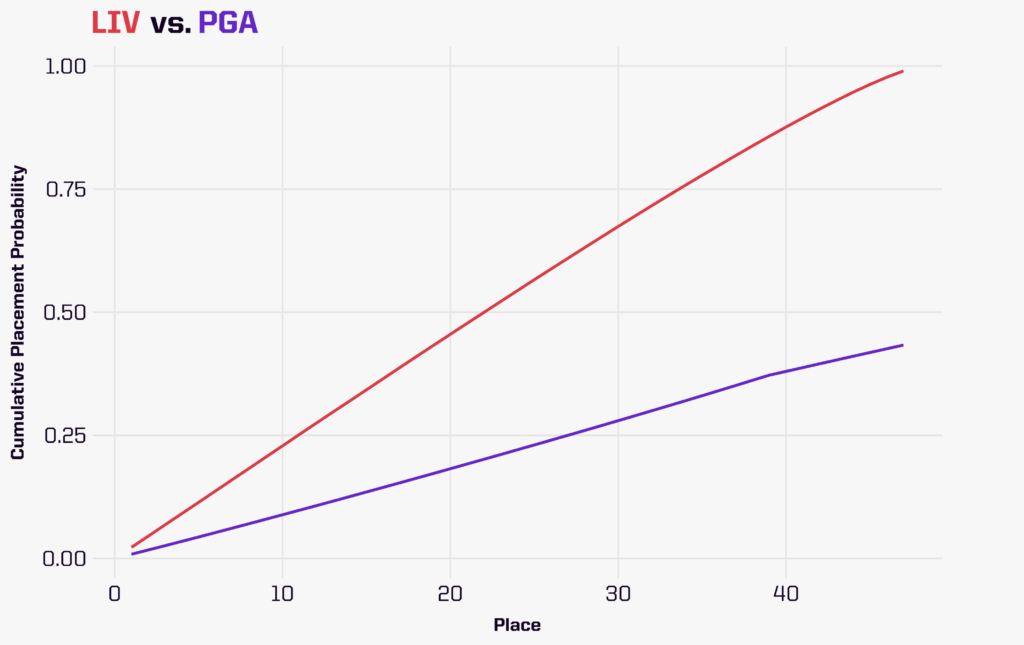
The LIV tour is a great example of why this type of modeling is important. LIV tournament fields are, on average, as strong as most PGA fields. The elevated PGA events are slightly stronger, and the non-elevated fields are slightly weaker, but on average they are about the same. The biggest difference is LIV golf plays three-round tournaments with only 48 golfers in the field, while PGA tournaments have between 120-156 golfers and play four rounds with a cut after two. These three factors of golfers in the field, number of rounds, and a cut are what we’ll focus on.
This chart shows the cumulative placement probability of LIV compared to PGA for the top 40 places. Remember, the data point for 15th place would be the probability of finishing in 15th or higher. There is a massive discrepancy between the two tours because of those three factors differentiating them. It is as hard to finish eighth in a LIV event as it is to finish 20th in an average PGA event.
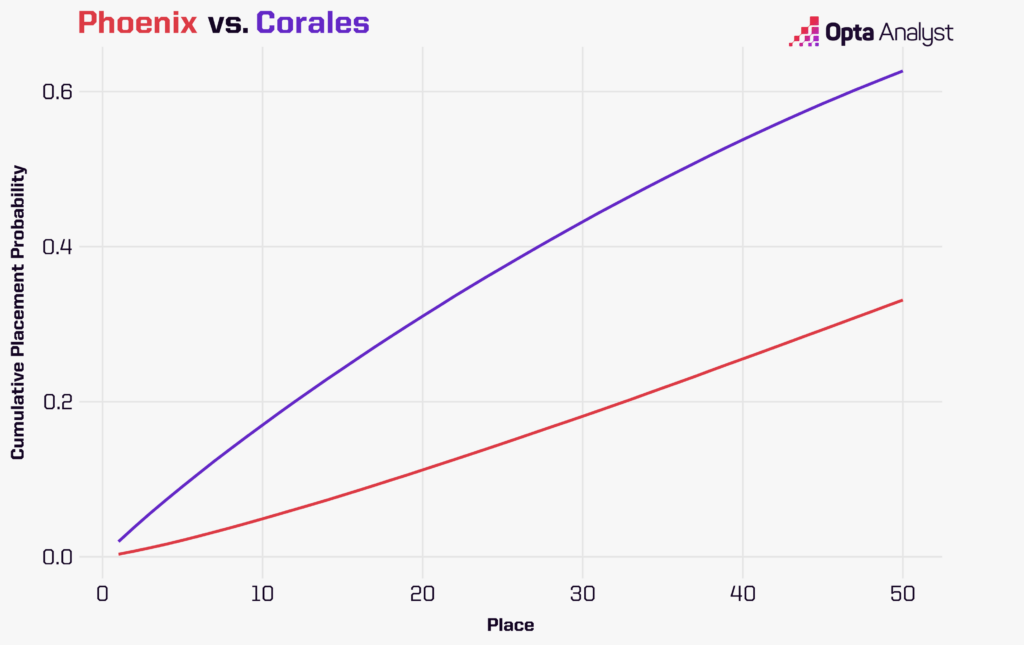
We can also look within a tour to see how field strength impacts how easy or difficult it is to score a quality finish. When comparing the Phoenix Open to the Corales Puntacana Championship, we see a similar pattern in which the more difficult field produces a tournament where finishing higher is more difficult. This is intuitive, and should not be surprising, but we wanted to make the point nonetheless.
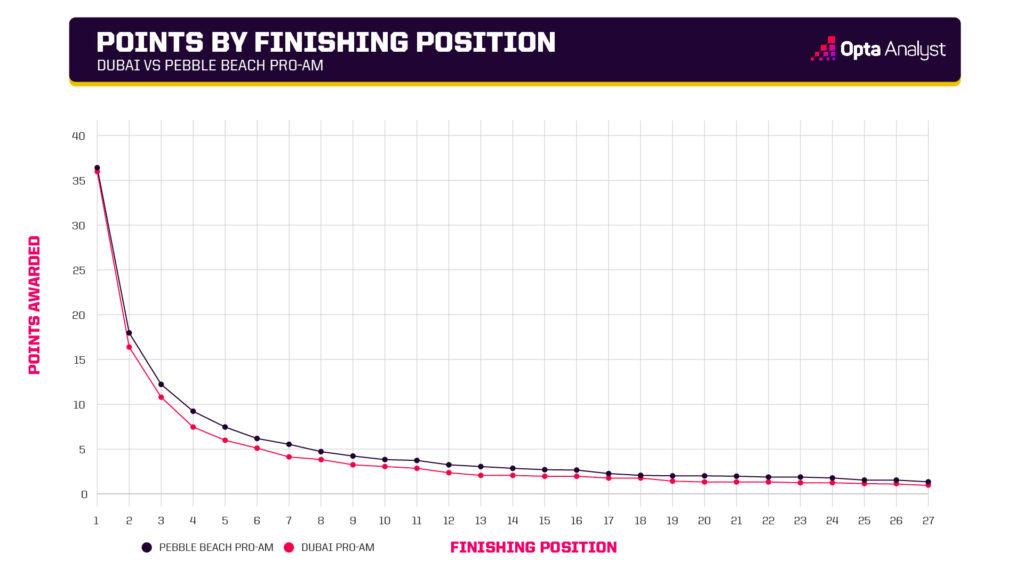
The composition of the field is also an important factor. Rory McIlroy teed it up in the Dubai Desert Classic and he was far and away the best player in the field. In the AT&T Pebble Beach Pro-Am, there were no golfers of McIlroy’s caliber, but it was a full field of mostly PGA average players. Looking at allocation of points, we can see that Pebble was a more difficult tournament to place in – except right at the top.
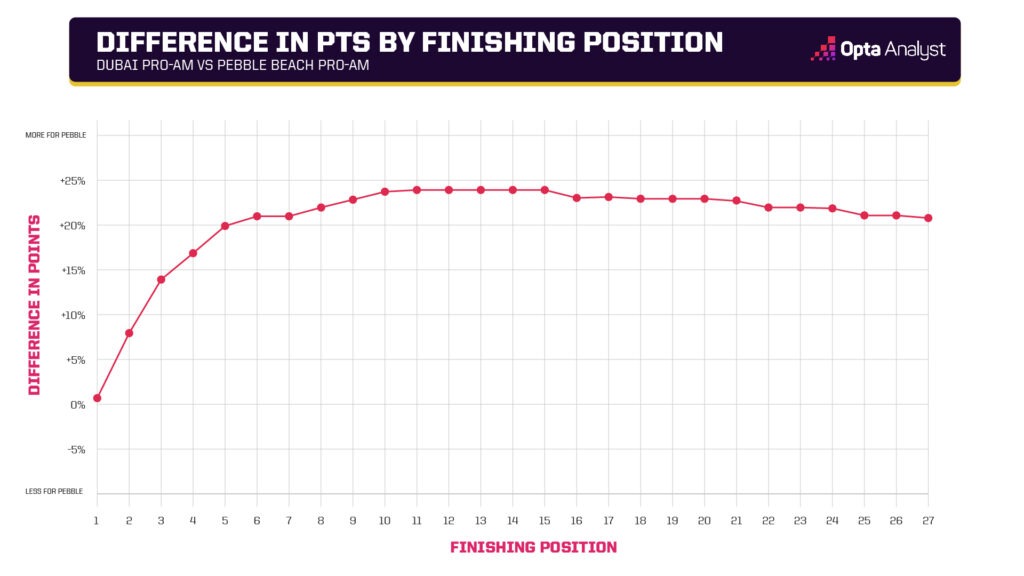
The two tournaments had an almost identical probability of winning for an average PGA player, but as you started getting further away from first place (where you no longer have to beat McIlroy), the depth of the field at Pebble Beach came into play. The 10th-place finisher at Pebble was awarded nearly 25% more points than the 10th-place finisher in Dubai. McIlroy’s presence alone makes the two tournaments equally difficult to win, but once you get past him the field strength differences are clear.
The Results
Here, we’re only looking at the 2023 calendar year for the PGA, LIV, Korn Ferry, DP World, Asian, Japan, and Challenge tours.
For total points, we did our best to try and match the same number of total points given out by the OWGR.
Here is the current top 20 as of April 11.
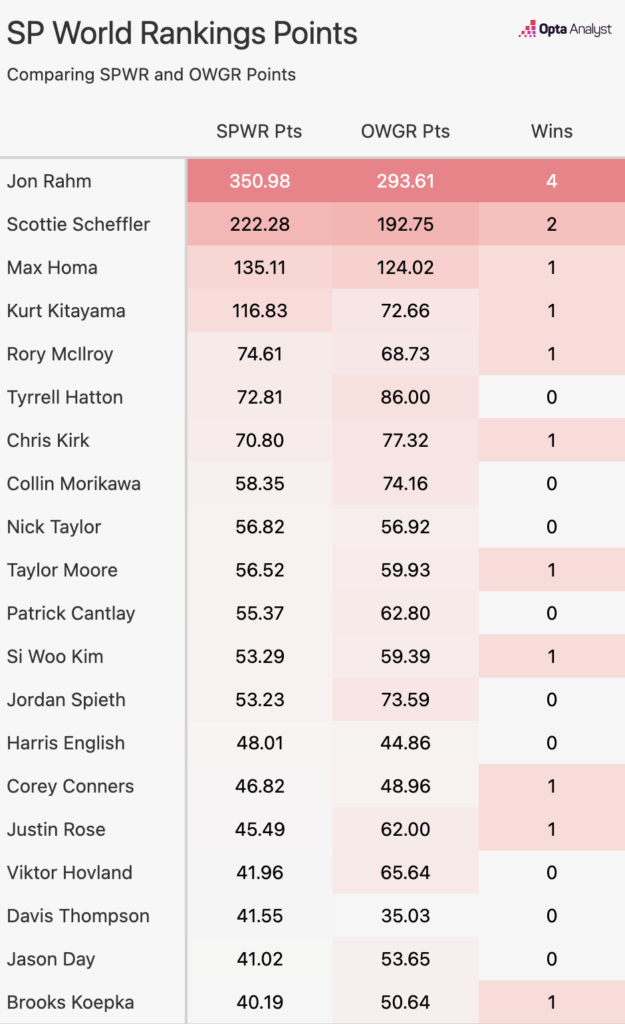
When the OWGR released its new methodology, one of the criticisms was that it skewed the ranking too much towards the PGA Tour. Our results show that the PGA is, for the most part, still getting fewer points than they deserve. Jon Rahm has accrued 293.6 OWGR points in 2023, but we think that number is 57 too few.
It’s not all because the PGA as a whole is not getting enough points, it’s also because winning should be more heavily rewarded.
Our model has a much steeper reduction in points given after the top few spots. Golfers who have received more than we think they should are Tony Finau, Cameron Young, Russell Henley, Viktor Hovland and Phil Mickelson. All have yet to win in 2023, but all except Finau (who has six top-20 finishes) have a top-five finish.
Because we use cumulative probability, we believe winners should, in most cases, receive at least twice as many points as second-place finishes. Winning is really hard to accomplish at the highest levels of golf, and we feel it is being under-rewarded.
LIV’s Problem
At the moment, LIV is not receiving any OWGR points. We aren’t here to dispute the OWGR’s criteria for how a tour is created and what that tour must accomplish to be recognized. What we can do is evaluate the structure of LIV and why, even if does get OWGR points, it may struggle to compete with the PGA Tour.
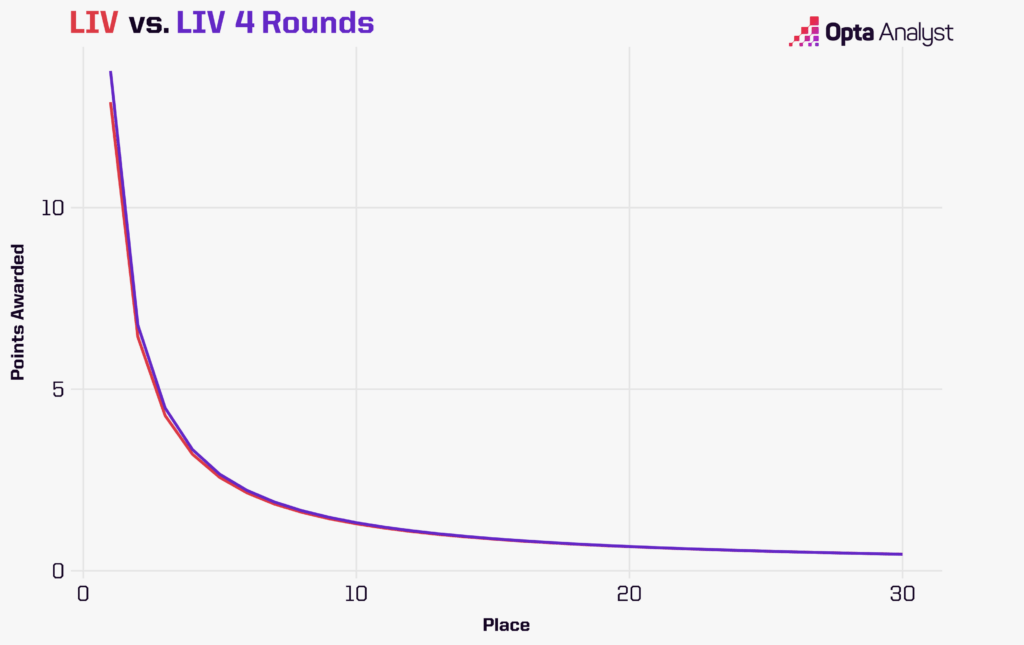
Let’s look at three factors of LIV: field strength, field depth, and tournament rules. First we’ll look at tournament rules. With only 48 golfers, it doesn’t make much sense to have a cut, so we’ll look strictly at the number of rounds. Every round played allows the best players a better chance of winning. Golf has plenty of volatility, but there’s a good reason why the best golfers in the world always end up at East Lake each year.
The higher the sample size, the less variability we’re going to see. If LIV played four rounds instead of three, it would make a small difference. Finishers would receive between 2-5% more points for their finishes than the typical three-round tournament.
In the long run that can absolutely mean the difference between a Masters invite and sitting at home, but it’s not the most meaningful.
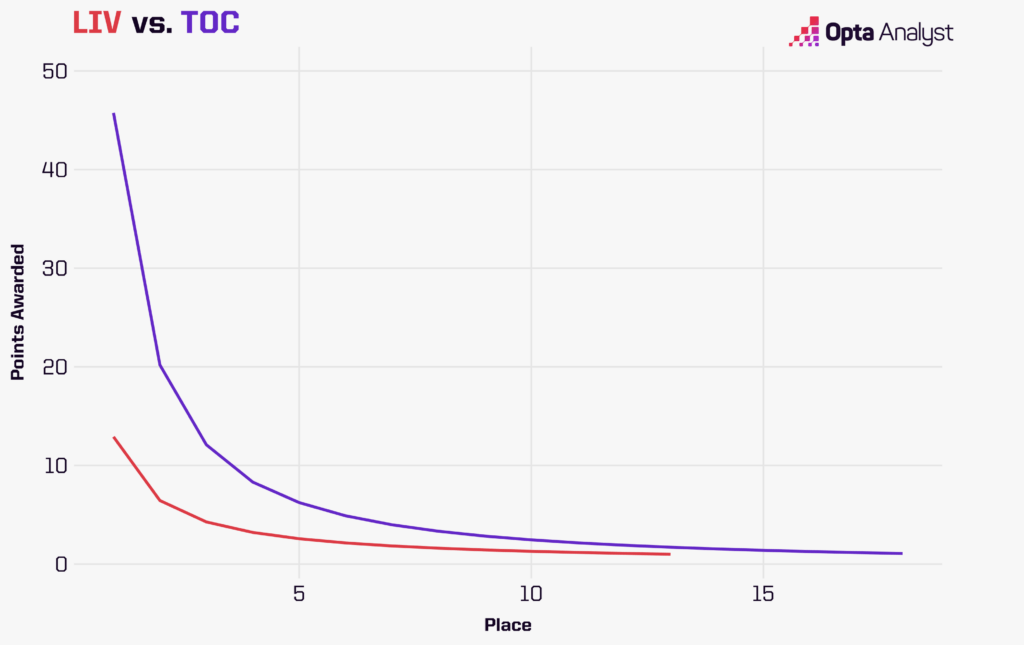
The second comparison we can do is centered around field strength. If we compare LIV Orlando to the Sentry Tournament of Champions (the closest the PGA has to a LIV-type event), we can see why LIV’s model was designed to have all of the top players in the world.
With a field strength like that of the TOC, you have a tournament difficult enough to win that the points become meaningful. As it stands, the winner of the TOC should be awarded more points than the winners of the three LIV tournaments played in 2023 combined.
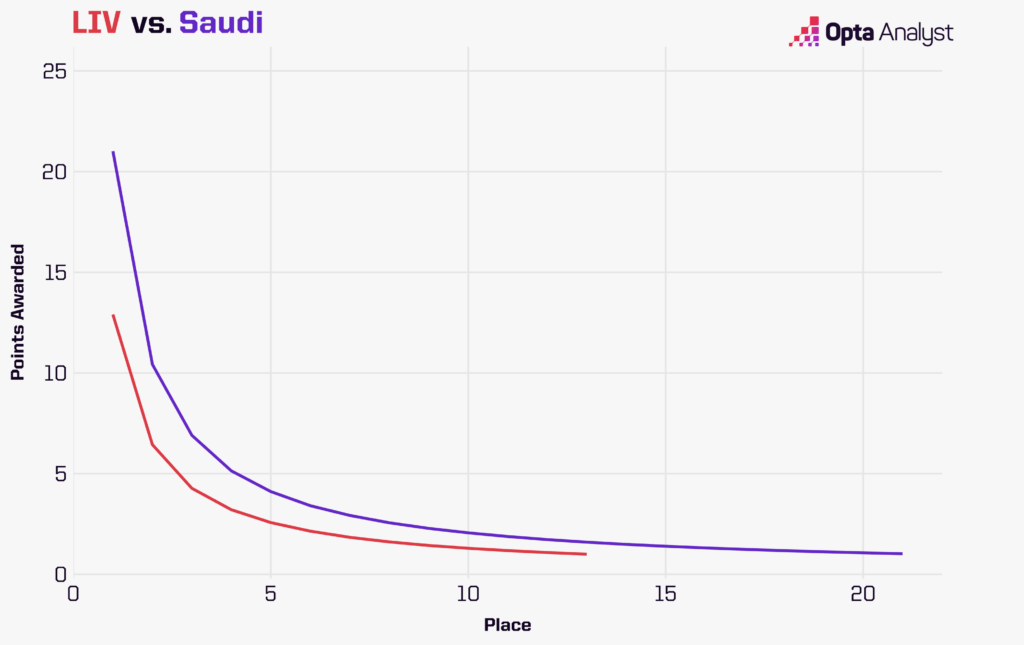
Finally, we’ll look at how many players are in the field. This is tough for LIV because it requires hiring a lot more golfers. The easiest comparison we can make is with the PIF Saudi International. It’s an Asian tour event that LIV players are required to play in, so it’s a good example of what would happen if LIV had to fill its rosters with a bunch of Asian Tour golfers.
We see another meaningful change as players are awarded around 60% more points for their finishes. Of course, full fields go against everything LIV was pitching in the first place, so we doubt that’s a viable solution.
With a handful of LIV golfers performing well at the Masters, it’s strange to think of future major championships without some of these players. But even if the OWGR accepted LIV into the fold, it will be difficult for the golfers on the LIV tour to stay eligible. Barring a mass exodus of some of the top golfers in the world to LIV or the OWGR deciding the give LIV way more points than their tournaments deserve, we will likely have major championships without the likes of promising young stars Joaquin Niemann, Matthew Wolff and Abraham Ancer.
Our Problems
Self-reflection is necessary, and we’re by no means saying our model is perfect. There are a handful of bugaboos we’re unhappy with and will continue working to solve.
The Best Players in a Field: The Abu Dhabi HSBC Championship is a perfect example. McIlroy was by far the best player in the field. After running our simulations our model gave him a 17% chance to win. That’s a big hurdle to climb for an average golfer, and the projected points allocations put a win on the same line as a win at the Honda Classic, despite a field strength difference of 0.7 strokes in favor of Honda.
In other words, McIlroy’s presence alone was inflating the projected points for the tournament. This would normally be a non-issue, except that McIlroy won the event. McIlroy did not have to beat himself (ignoring the mental health aspect of course) and an average player’s chances of winning would have been higher had they also not had to beat McIlroy. McIlroy’s presence resulted in McIlroy himself garnering extra points.
We’re unsure if there’s a solution to this issue, or if it is even an issue at all. It just feels a little like the old OWGR system of players taking advantage of their own points to get more points. On the other hand, if we were to look at who individual golfers beat, it would make it harder for top golfers to gain points.
New Courses: This is only a problem if predicting point allocations prior to tournaments starting. Because we use course information in the tournament simulations, tournaments held at courses where we don’t have data present a problem.
Projecting allocations of points would not be an impossible task. We can use scorecard and flyover information to estimate how a course will play, but to be comfortable with the results, we would want to run the simulations again after the tournament once we have course information.
Upwards Mobility: A good qualification system and a fair qualification system are not necessarily the same thing, depending on what it’s trying to accomplish. Golf is great because if you play well at one stop, you can take the proverbial bus to the next stop.
Challenge Tour success should lead to DP World Tour starts and DP World Tour success should lead to the PGA Tour. This is an area we’ll be looking into with our ratings, but because we’re awarding more points for wins, we’re bullish on what the tour-to-tour mobility problem will look like.
Of course, it hinges on winning tournaments, but we’d argue that should be the goal anyway.