There’s an old baseball adage that things will even themselves out at the plate.
For every line drive hit right at someone, there’s a bloop single or slow-rolling infield hit around the corner.
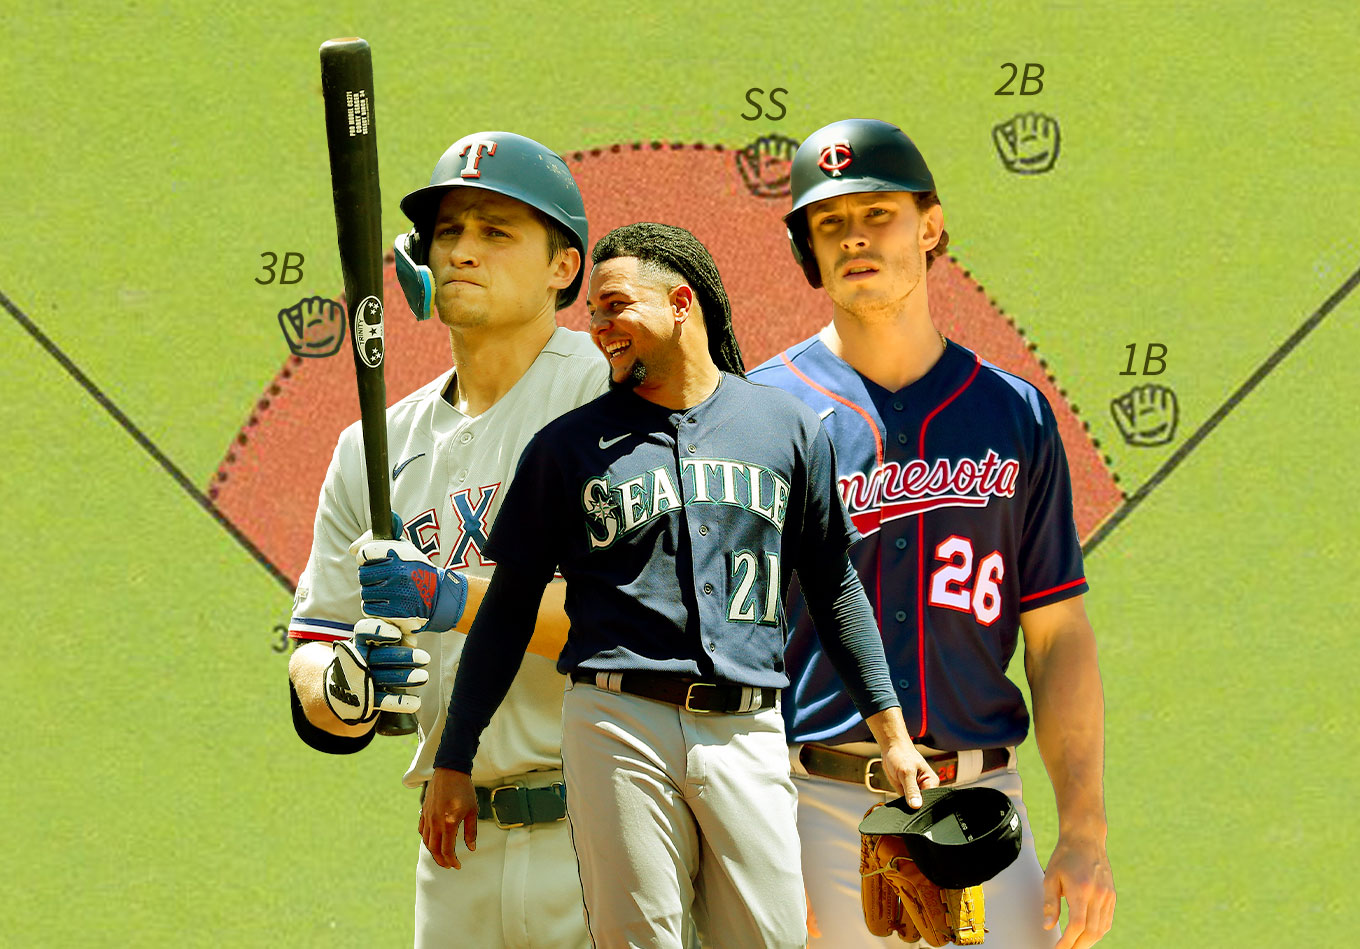
But Texas Rangers shortstop Corey Seager likely wasn’t buying what the baseball gods have been selling when it came to hitting against the shift.
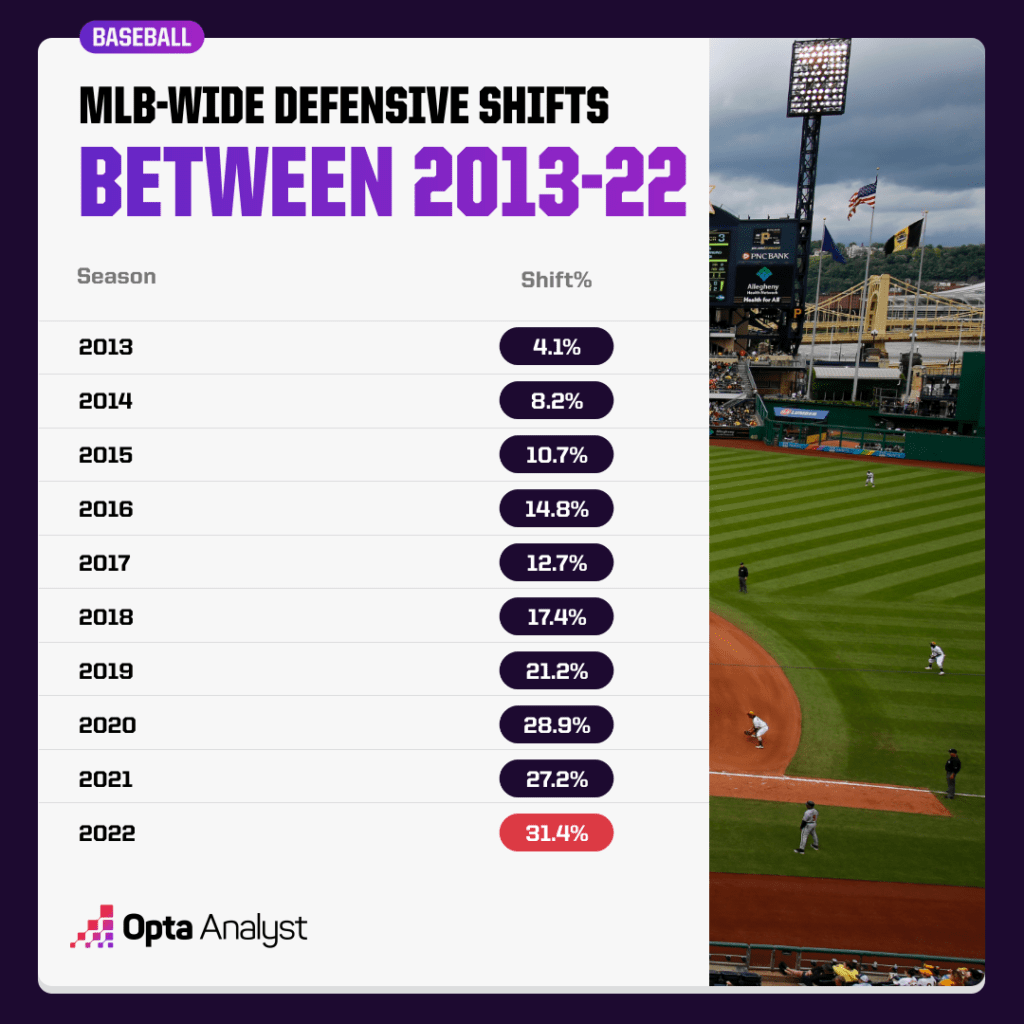
The defensive shift did that to many hitters since coming to prominence in recent years. As the strategy started to spread, the percentage of plate appearances that have included an infield shift rose from 4.1 in 2013 to an all-time high of 31.4 in 2022, according to our data.
It’s not much of a coincidence that the MLB-wide batting average went from the .250s between 2010-17 to .248 in 2018, .252 in 2019, .245 in the pandemic-shortened 2020 season, .244 in 2021 and just .243 in 2022.
That was the lowest average since the lowering of the mound in 1969. It also means the league never adjusted like some believed it would when the shifting became widespread.
The idea was that just a few hits the other way or some bunt attempts to the empty side of the field would put a quick end to all the shifting nonsense. But it simply never happened. No one took that approach at the plate – at least not enough to make a difference.
So the league finally felt the need to step in and banned the defensive shift for 2023.
“The shift has become an increasingly big part of the game and we got a lot of feedback from fans saying, ‘We’ve grown up knowing that a line drive, one-hopper in front of the right fielder is supposed to be a base hit,'” league consultant Theo Epstein told CBS Boston. “Over the last five years or so, that has been a routine ball to the third baseman who has shifted over playing short right field. Now, there will be two infielders on either side of second base, and all four infielders can’t be deeper than the outfield grass. It is going to be pretty noticeable, but hopefully in a good way. I hope its going to restore the aesthetic to baseball to what fans remember growing up.”
Could it also spell the end of the launch-angle era? It’s entirely possible considering that the Washington Post reported in 2017 that many hitters cited the shift as the primary reason they chose to focus on hitting the ball in the air after years of hitting coaches telling them to hit low line drives.
Of course, the reality is that the change projects to have a positive effect on some players and teams more than others.
Using data that tracks batted balls and final defensive alignments of at-bats, we can tell which hitters have lost the most hits due to the shift, which pitchers have had the most hits prevented by it, which teams have taken away the most and which have had the most taken from them by these strategic formations.
We define a shift as any time there are three infielders on one side of second base. How can we tell if a batted ball would have been a hit against a normal alignment? There’s certainly some level of judgement involved, but in most instances, it’s not a difficult assessment to make.
As you may have expected, what we found in the data is that shift ban will most benefit left-handed batters. But which lefties specifically?
That question brings us back to Seager, who has remarkably hit .275 over the past three seasons and earned his third All-Star appearance in 2022 despite being the player who has been hurt the most by defensive shifts since 2020.
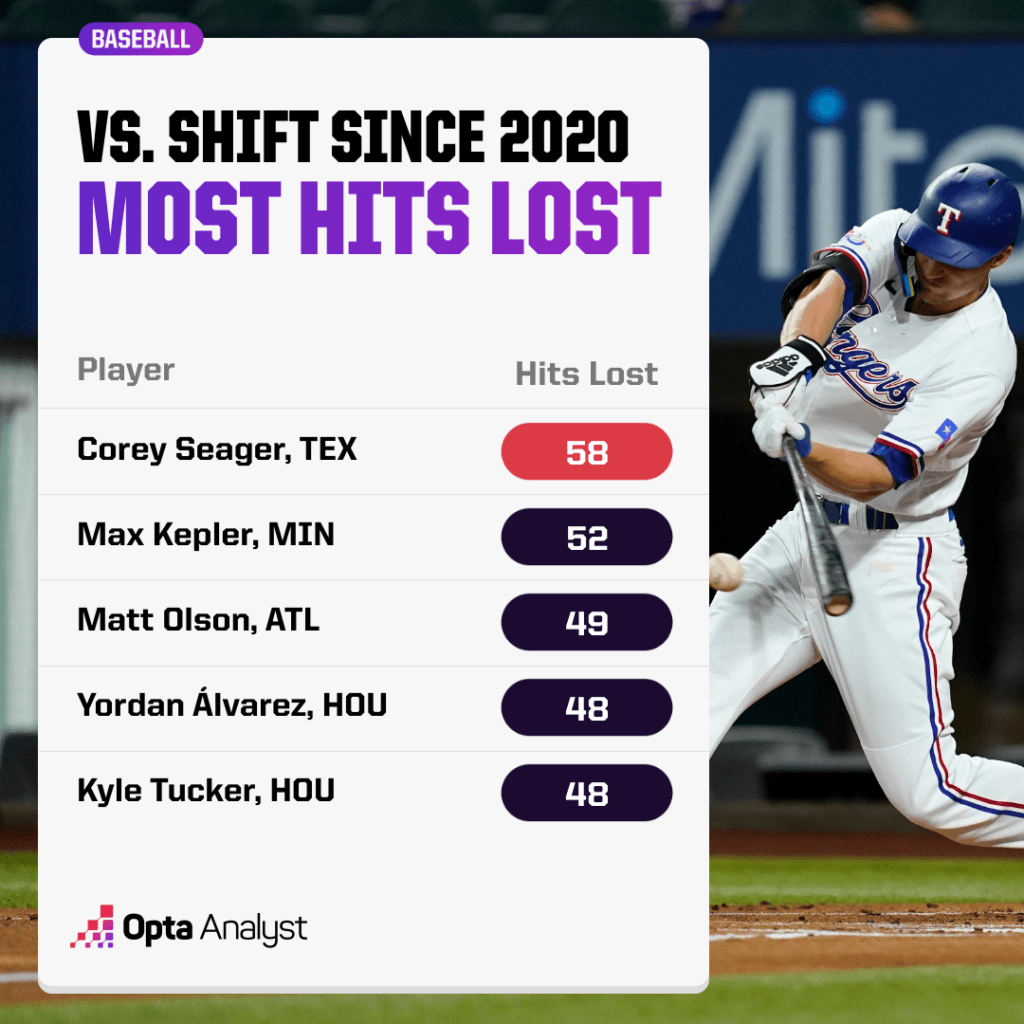
Let’s try to put this in a little bit of perspective. What if Seager had been playing under the rules that will go into effect this season? He’d have 58 extra hits over the past three seasons that would lift his batting average 49 points from .275 to .325.
For Max Kepler of the Minnesota Twins, a meager .220 average since 2020 suddenly would have been a respectable .273 given the 52 hits he’s lost. Former Oakland A’s first baseman Matt Olson, now with the Atlanta Braves, would have hit .281 instead of .246 if he had those 49 hits prevented by the shift.
You get the picture.
And even though we’re looking at the extreme end of the spectrum, it’s easy to envision how the league-wide batting average should ease closer to a more traditionally acceptable number when more hits are given back to the offense.
Of course, there’s a flip side to that equation. For pitchers who keep the ball down, the shift has likely come up big in several key moments. We’ve all seen that guy in short right field stop a liner that would have extended a rally or the infielder behind second base corral what would have been a two-run single.
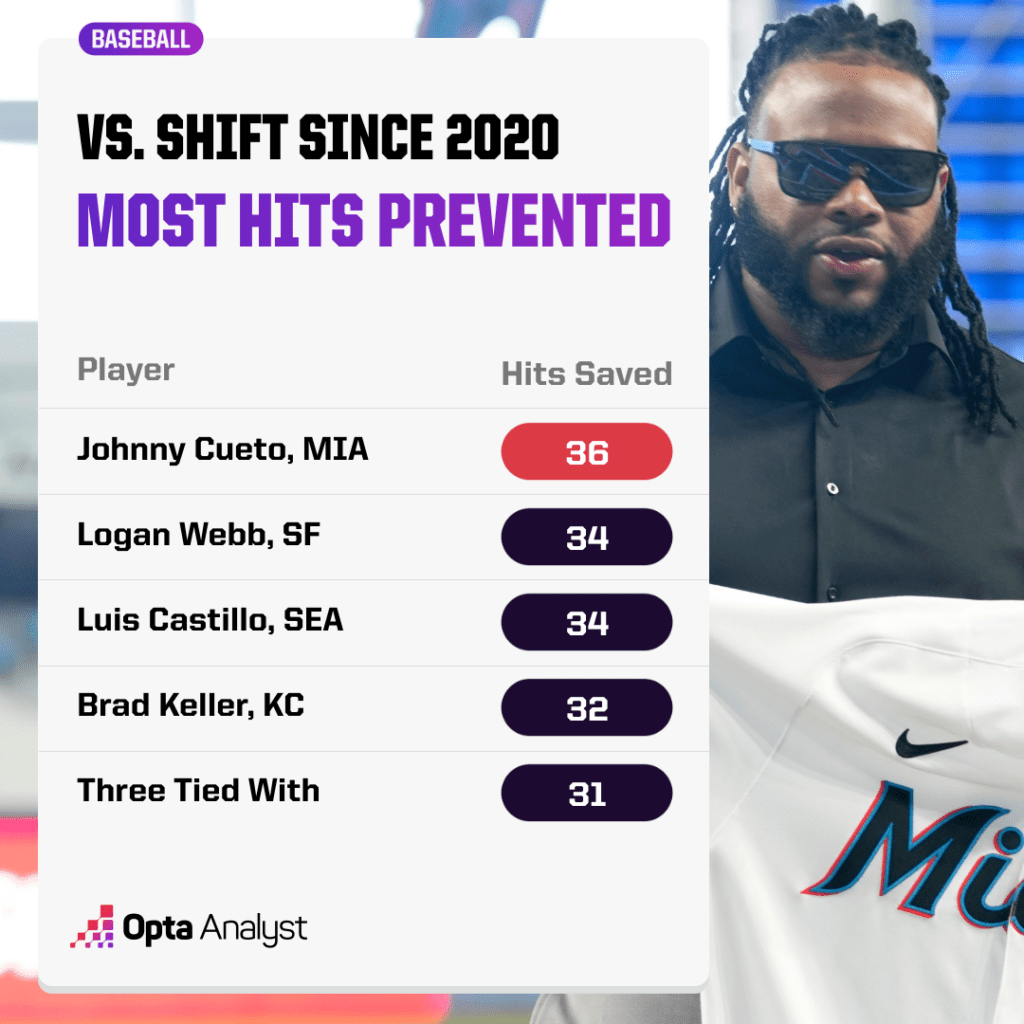
It shouldn’t be a surprise to see pitchers like Luis Castillo of the Seattle Mariners, Logan Webb of the San Francisco Giants and Brad Keller of the Kansas City Royals among those who have had the most hits prevented by their team’s shift.
Webb ranks second (57.8%), Castillo sits fourth (53.8%) and Keller is eighth (51.6%) in highest ground-ball percentage among those with at least 300 innings since the 2020 season.
While it’s difficult to say how many runs these hits would have led to if not prevented, we can tell you that just adding the 36 hits to Cueto’s line bumps his batting average against over the past three seasons from .269 to .297.
Opposing batters would be hitting .268 instead of .245 against Webb, who has gone 26-12 with a 2.96 ERA over the past two seasons. And the opposition would be hitting a troubling .299 off Keller, who was moved to the Kansas City bullpen in 2022, instead of the .274 average he’s allowed over the past three seasons if we adjusted for those 32 hits.
At the plate, the Houston Astros have been hurt by the shift more than any other team since 2020, while the Los Angeles Dodgers aren’t that far behind.
But consider that Houston ranks fourth (.255) and Los Angeles ninth (.251) in team batting average over this span regardless.
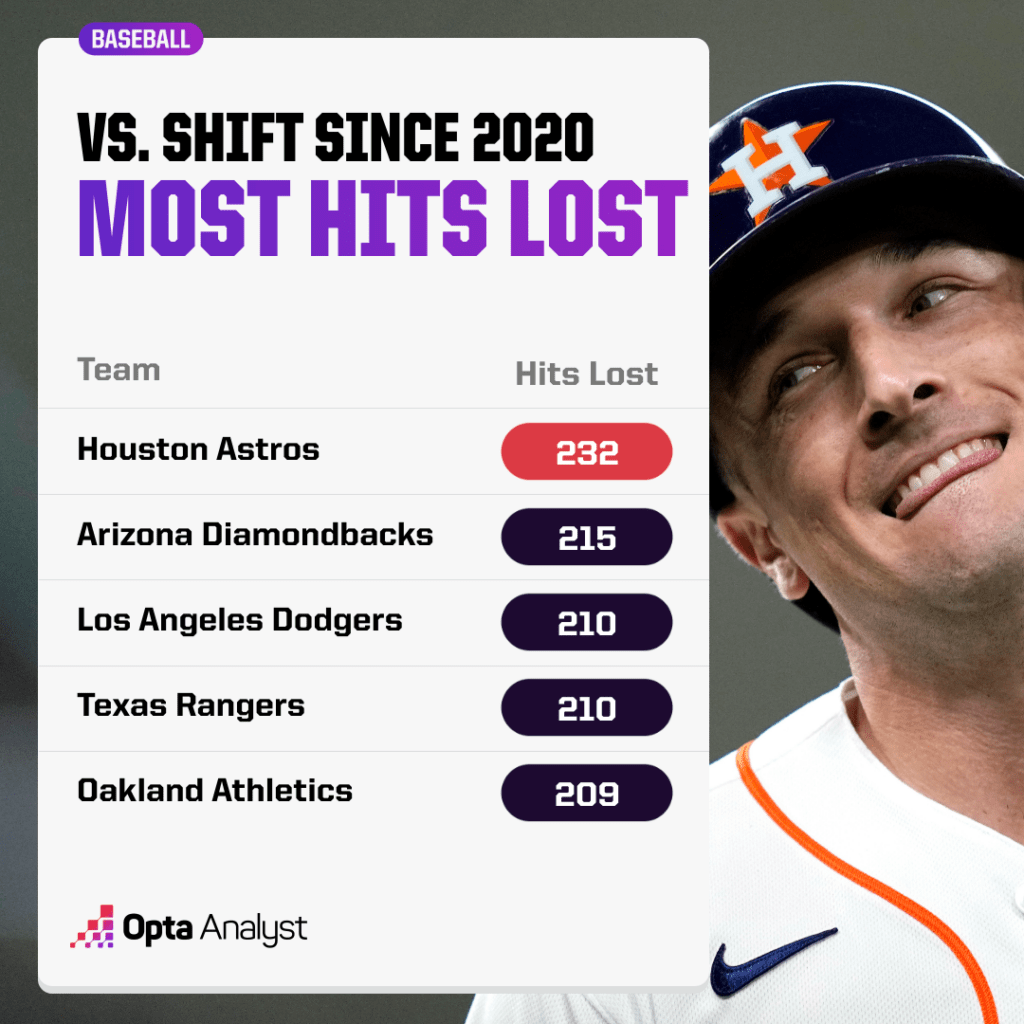
What’s interesting about this is that the Dodgers (39.0%) and Astros (41.0%) have two of the four lowest ground-ball percentages in the majors over this span. So they haven’t been hitting many grounders (both are in the top six in home-run rate), but when they did, they were getting gobbled up by the shift.
Where would they be if we gave them those hits back? The Astros would have a team batting average of .273 (up from .255), while the Dodgers would be up to .268 from .251.
Keep in mind that only three teams have finished a full season with a batting average of .272 or better since 2017 – the ’17 Astros (.282), ’19 Astros (.274) and the ’17 Colorado Rockies (.273).
Let’s look at which pitching staffs might be in trouble without the ability to lean on the defensive shift this season.
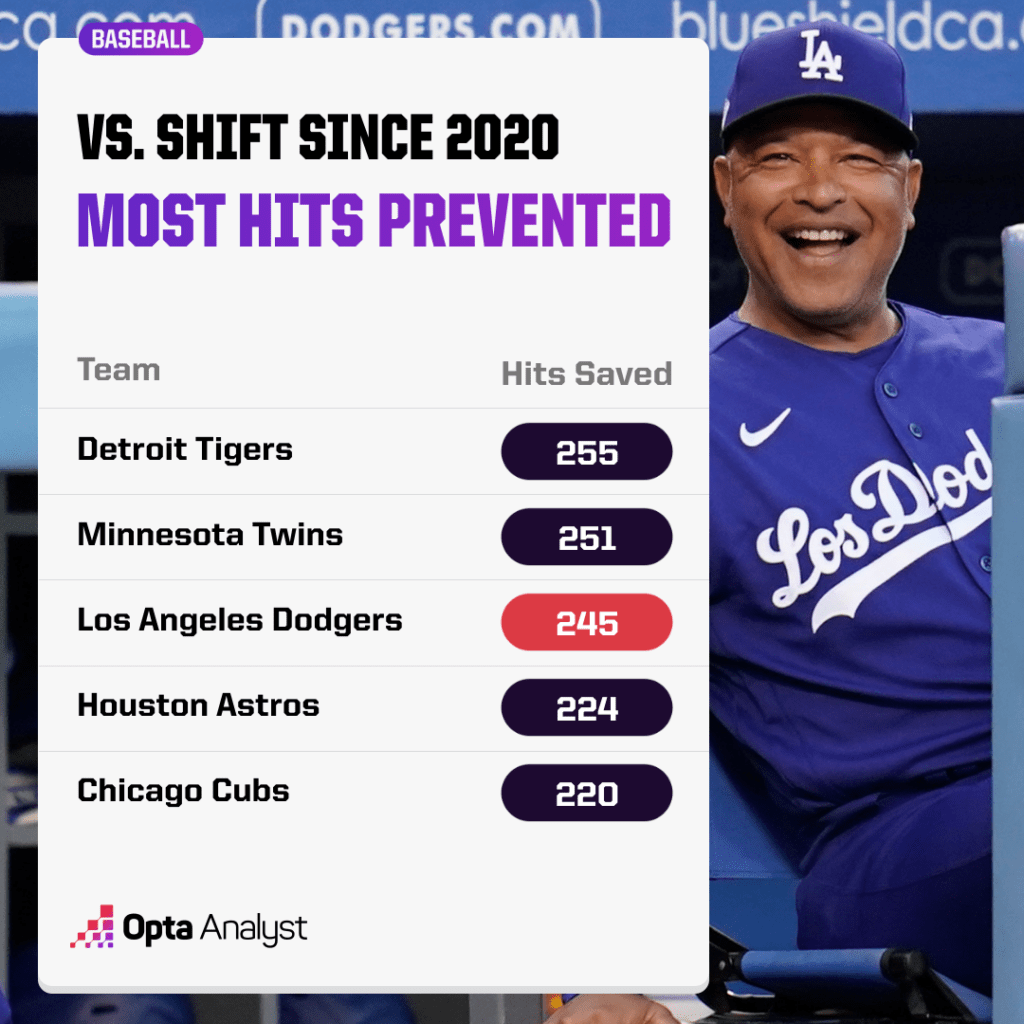
The Detroit Tigers rank 21st in the majors with a 4.39 ERA and 23rd with a .252 opponent batting average since 2020. And that’s even though they’ve prevented the most hits by use of the shift over the past three seasons.
A good number of grounders combined with solid defensive shifting appears to have led to the high hit-prevention totals for the Astros, Dodgers and Chicago Cubs. All three teams rank in the top 10 in highest ground-ball percentage since 2020.
That strategic placement has played a key role in the Dodgers easily having the best pitching performance in the majors over this span. Not only do they own an MLB-best 2.92 ERA (the Astros are second at 3.49), but they’ve also limited opponents to a ridiculous .209 average (Houston is next at .223).
Now we realize that looking back doesn’t necessarily mean we know what’s going to happen once the 2023 season starts. But what we do have is a pretty good idea about who will feel a whole lot better when it does.
None more than Corey Seager.
Research support provided by Stats Perform’s Jesse Abrahams.