
The Philadelphia Union’s performance in the 2022 Major League Soccer regular season was remarkable for a number of reasons. They defied expected goals (xG), regularly ceded possession and territory to their opposition, played the most direct soccer in the league, and by the end of the season had been arguably the best team in it.
In terms of league placing, it was also the second-best season in the club’s history. It has seen them finish top of the Eastern Conference having scored the most goals and conceded the fewest in all of MLS.
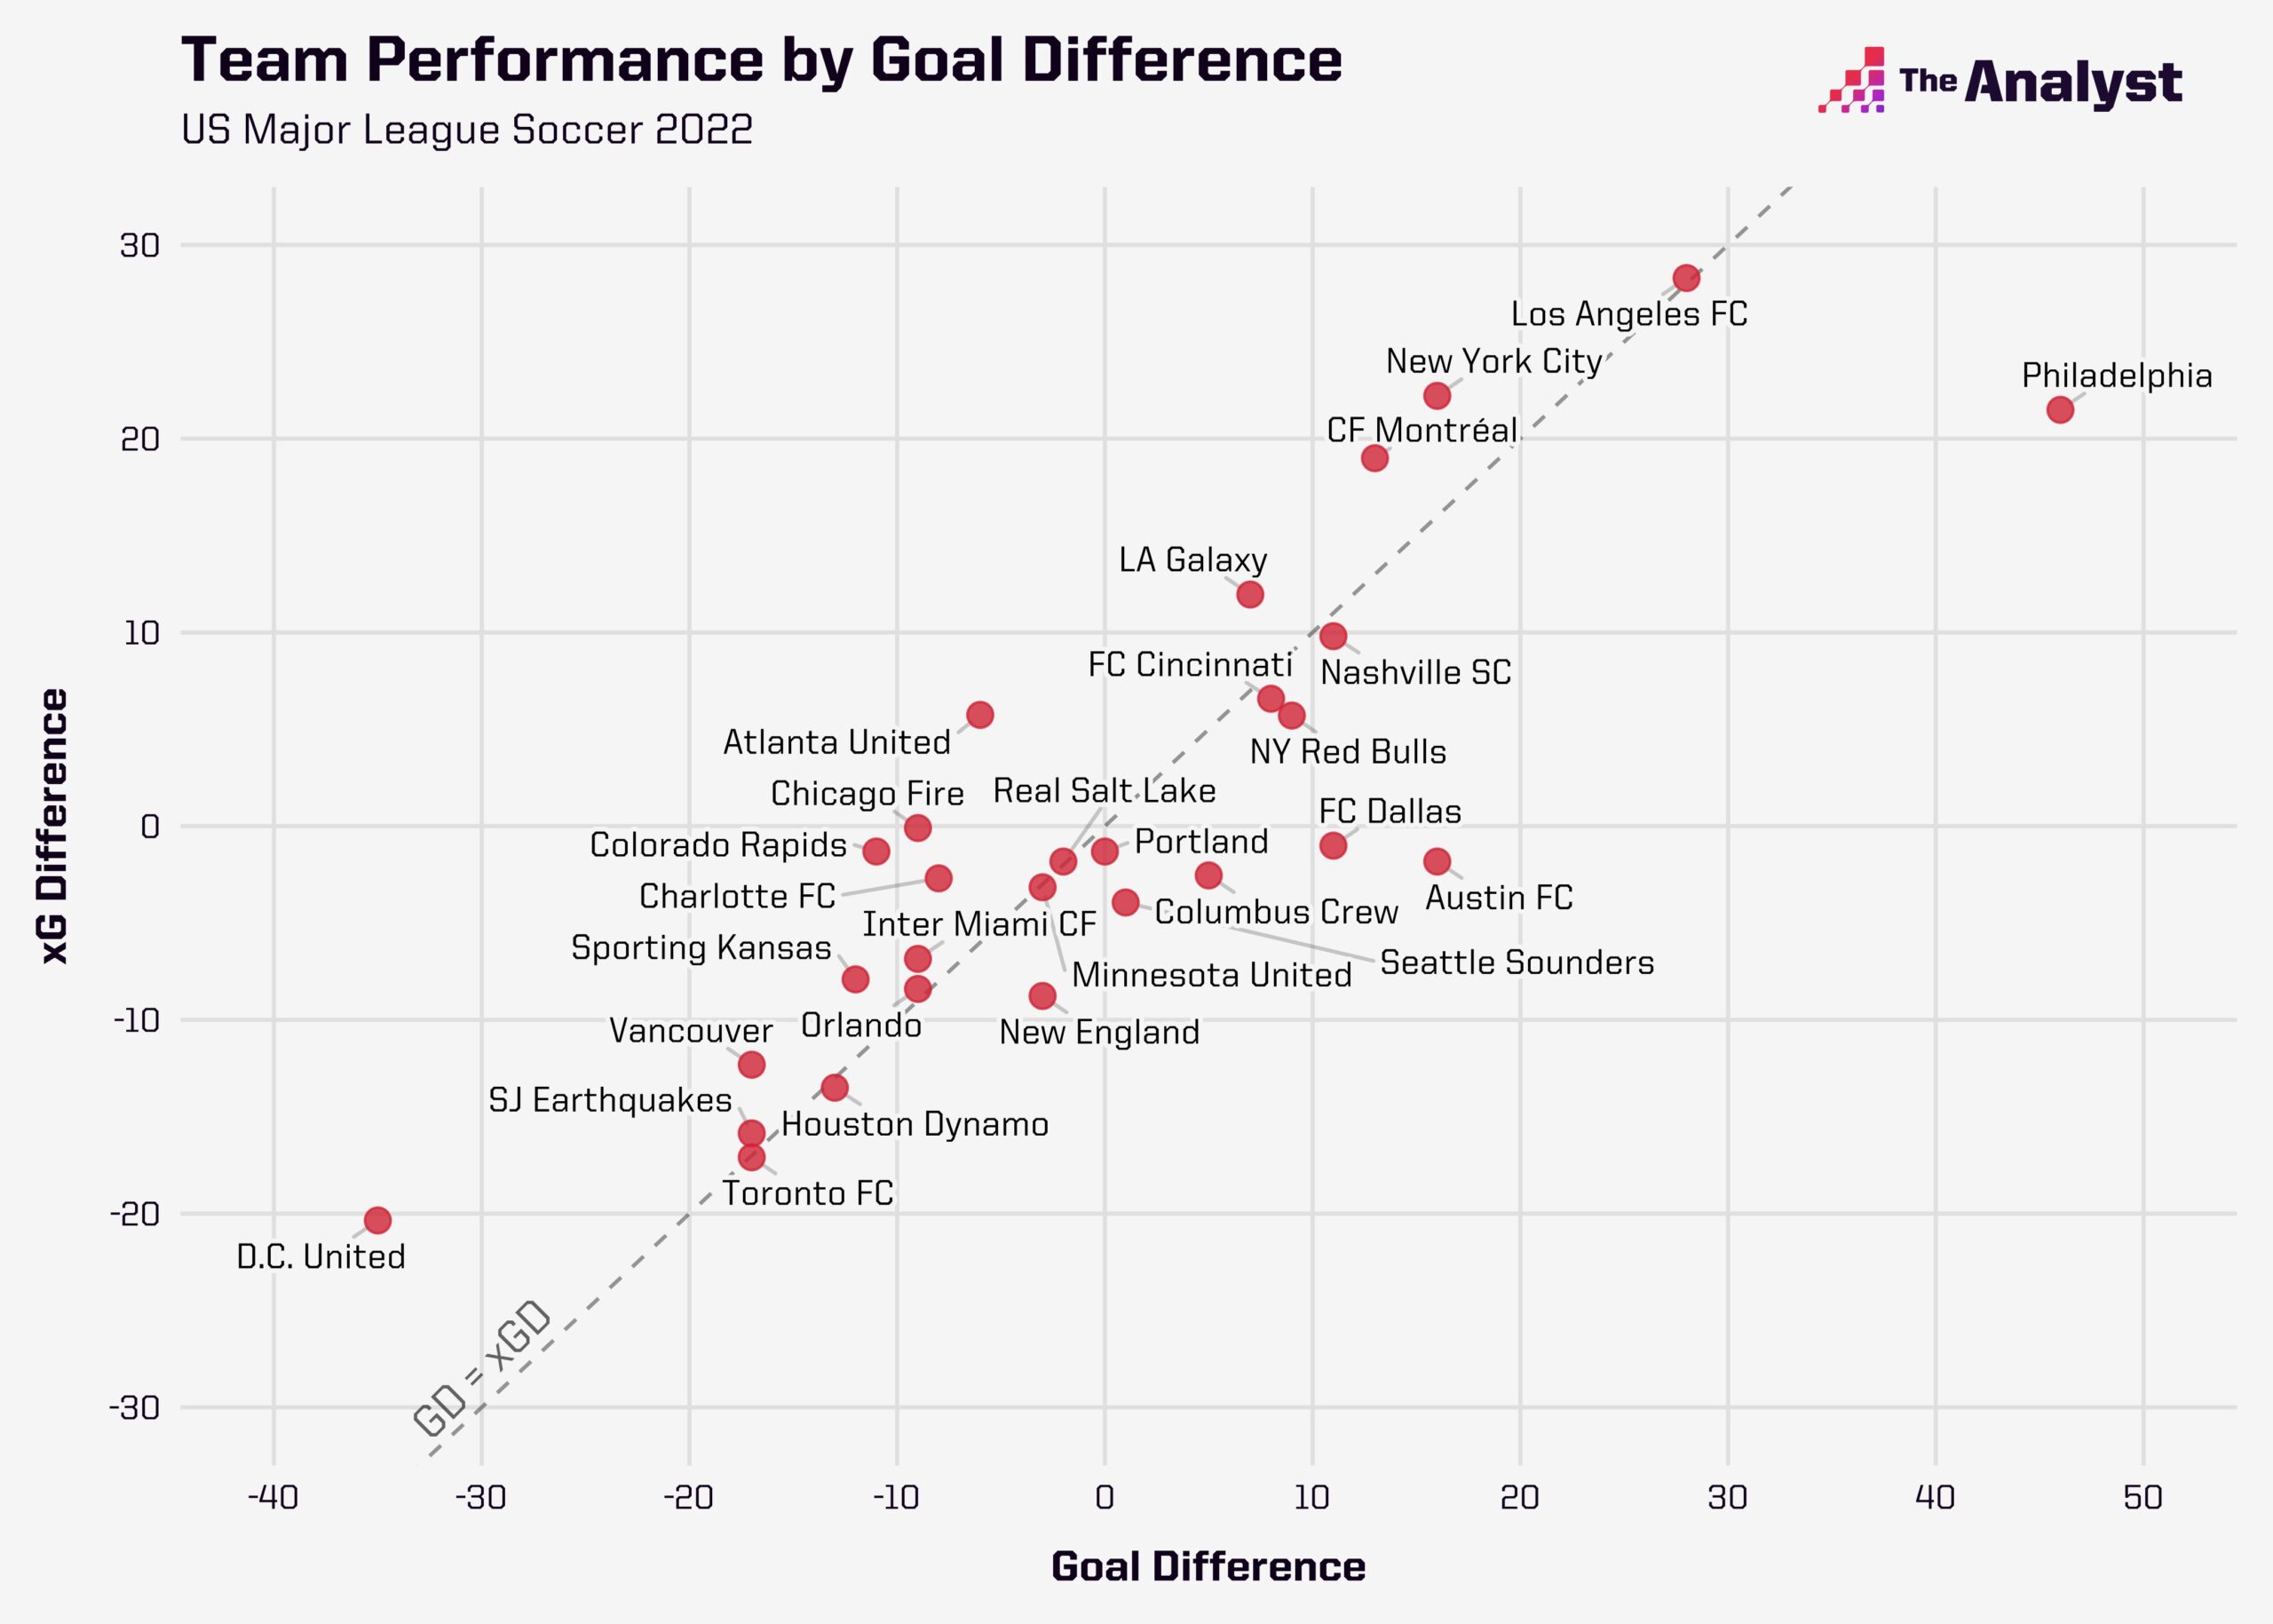
The only thing that prevented the Union from winning the Supporters’ Shield (awarded to the overall points leaders of both conferences) this year was the order of tiebreakers in MLS, which counts wins before it counts goal difference. They finished level on points with eventual leaders Los Angeles FC, but despite having a better goal difference than the West Coast side, the Union lost out due to having two fewer wins.
The only time they have bettered this performance was back in 2020 when they finished atop the overall standings to lift the Supporters’ Shield – the club’s first-ever trophy – but that 2020 campaign was truncated due to the COVID-19 pandemic, meaning they played 11 games fewer than they have this season. Taking this into account and considering their exploits this year, plus the fact they have seen key players such as Brenden Aaronson, Jamiro Monteiro, Mark McKenzie, and last season’s top scorer Kacper Przybyłko depart since then, it could well be said that this 2022 campaign was more impressive than their Shield-winning one in 2020.
The Union, led by American head coach Jim Curtin since 2014, have been able to put together such an impressive season thanks to good performances throughout the team, all the way from the goalkeeper to the strikers, and also thanks to a defined tactical setup that goes against the grain somewhat and makes them such an interesting team to analyze.
On the face of it, some of the data suggests there might have been an element of luck, but there are also reasons they are able to overperform in terms of outscoring their xG and also conceding fewer goals than their xG against suggests they should.
They have recruited well to replace those who have departed, signing Designated Players (DP) in attack — Julián Carranza and Mikael Uhre — who can offer a cutting edge when it is most needed, while 2021 acquisition Daniel Gazdag has also come into his own this year. This is one of the reasons they have been able to outperform their xG. They have star performers in both boxes.
New arrivals are always signed with the system in mind, and it is a system that has been in place for some time. This makes it easier for the club and their sporting director Ernst Tanner to identify the appropriate players, and in turn, can make it easier for said players to settle into their roles.
When watching them throughout the season, it is simple enough to see a basic outline of what type of team the Union are, but digging deeper into the data starts to fill in the gaps. In most cases the data supports what is seen on the pitch, and also answers a few of the questions that might be raised.
Looking at the xG numbers in more detail suggests the Union have been one of the ‘luckiest’ teams in MLS this season. They had the biggest difference between non-penalty xG conceded and actual goals conceded (-12.9), meaning they conceded far fewer than would have been expected given the shots they faced. They also scored 63 goals from a non-penalty xG of just 52.5 (+10.5) — the second biggest attacking overperformance in the league, behind Austin FC (+12.2).
This could suggest an eventual regression to the mean, possibly in the playoffs, but the reasons for this xG defiance at both ends of the pitch may go beyond mere luck, thus making it more of a sustainable thing.
My MLS Wages charts show you payrolls across the league & salary disparities within each roster.
— Steve Fenn (@StatHunting) October 17, 2022
Thanks @MLSPA for the data.
Check out the interactive @tableaupublic to see previous seasons: https://t.co/F2CMPrE6Dz pic.twitter.com/LYPybdAPyf
A combination of the best goalkeeping in the league from Andre Blake, the compact shape that limits opposition shot quality, those DP forwards, and economical shooting at the other end can go some way to explaining their success.
That economical shooting is demonstrated by the fact Curtin’s side had the third-best average xG per non-penalty shot in the league with 0.119 or, looking at it another way, an average expected shot conversion of 11.9%. But it was in defense where they really exceled, restricting their opponents to the lowest quality average xG per non-penalty shot in MLS in 2022, with 0.081 — an average expected shot conversion rate of 8.1%.
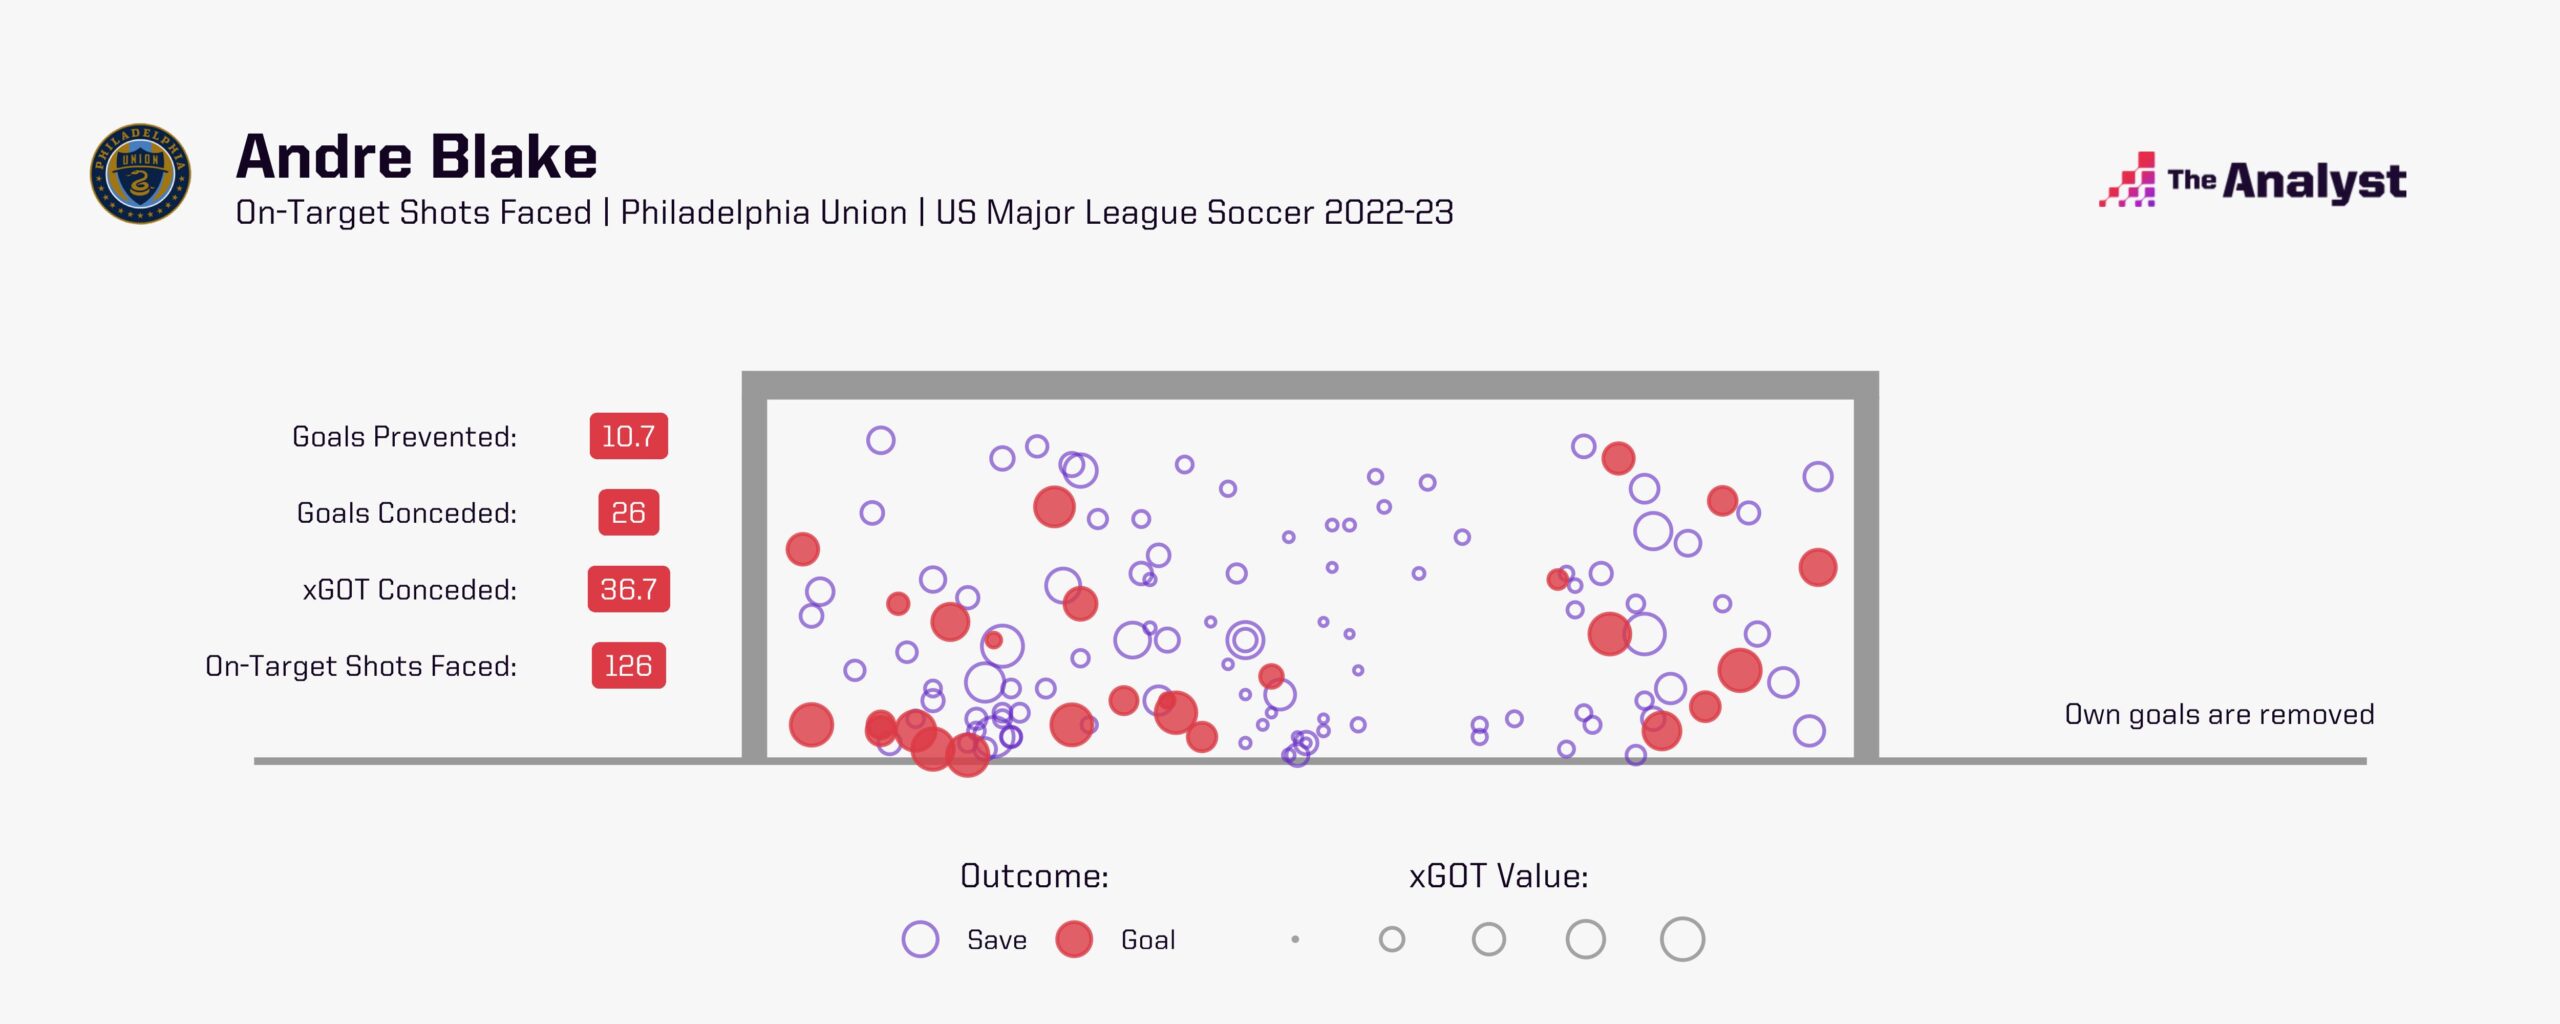
Based on the quality of shots on target Blake faced, as demonstrated by the expected goals on target (xGOT) data, the Jamaican goalkeeper’s performances prevented 10.7 goals. The only player to do better in this regard was New England Revolution keeper Djordje Petrovic with 14.3.
Of course, goalkeepers who face more shots could have an advantage in this area in terms of total xGOT faced, but another metric called goals prevented rate levels the playing field.
Goals prevented rate is defined as: “the number of goals a goalkeeper was expected to concede as a proportion of the number of goals they actually conceded.”
In 2022, the quality of shots on target faced by Blake would have expected him to concede 1.44 goals for every goal he actually conceded. This is only bettered, again, by Petrovic’s performances with the Revs (1.58).
Petrovic’s numbers are inflated by four penalty saves, though. He was busy in this regard as New England conceded a league-high 12 penalties. Blake, on the other hand, only faced five penalties saving one. Excluding penalties, Blake has both the best goals prevented total (9.8) and the best goals prevented rate (1.45) in MLS this year.
Is having a good goalkeeper who defies xG lucky, or simply good recruitment in the position combined with a defensive system that gives them a chance to make saves?
The goals-prevented map below, which includes all shots on target faced, including penalties, shows Blake saved a number of big chances. It all reinforces the idea that he is the best goalkeeper in MLS and will likely win Goalkeeper of the Year (an award for which Petrovic is also a deserved finalist).
Another noticeable aspect of Philadelphia’s play is compact shape. It’s used a 4-4-2 diamond formation for some time now and from this platform, the Union are able to press from the front with their two strikers but also drop back into a narrow block that can prove difficult for teams to break through.
How narrow a defensive line is on average throughout the season can be difficult to measure, but our absolute width per sequence metric – the maximum distance (in metres) a team gets from the centre of the pitch per open play sequence – gives us a good insight into a team’s general width.
The Philadelphia Union’s absolute width average in MLS 2022 is just 24.0 meters, which is the second narrowest behind the New York Red Bulls (23.6m).
When coming up against the Union, opponents average an absolute width per open-play sequence of 25.1m. This is only lower than teams versus FC Cincinnati (25.4m) and the Vancouver Whitecaps (25.3m). Those four other aforementioned teams regularly pop up when looking at the Union’s tactical traits, suggesting similarities between them. The Union appear to be able to execute better than anyone else, perhaps thanks to their diamond formation and their players’ familiarity with it.
As well as the goalkeeper, Blake, the Union’s center-backs, Jakob Glesnes and Jack Elliott, play a big part in what is the best defense in the league in terms of goals conceded. Both are present in the top 10 in MLS for blocks this season, with 29 and 27 respectively, but despite ceding a lot of possession to their opponents, the Union as a team are only around mid-table for shots allowed.
When confirming the low possession numbers, we come across those familiar names. Only the New York Red Bulls (42.7%) and Vancouver Whitecaps (41.7%) averaged less possession this year than the Union’s 43.7%. As shown in the zones of control graphic below, the Union are happy to let the opposition control the field in terms of possession.
There was the potential for a Red Bulls-Union clash in the playoffs in the Eastern Conference semifinals, but the side from New Jersey lost their first-round playoff to FC Cincinnati — a team that happens to have the fourth-lowest average possession in the league.
Comparisons between the Red Bulls and Philadelphia have been more noticeable, maybe more high profile, than those between Philadelphia and Cincinnati, but this semifinal game would throw up similar tactical intrigue regardless of which of those two teams the Union faced. Incidentally, Cincinnati is coached by former Union assistant Pat Noonan, and its general manager is former Union technical director Chris Albright, which no doubt contributes to the similarities.
The Red Bulls follow a high-pressing, high-intensity game plan not dissimilar to other Red Bull GmbH-owned sides in other leagues, but the Union have beaten them at their own game this season.
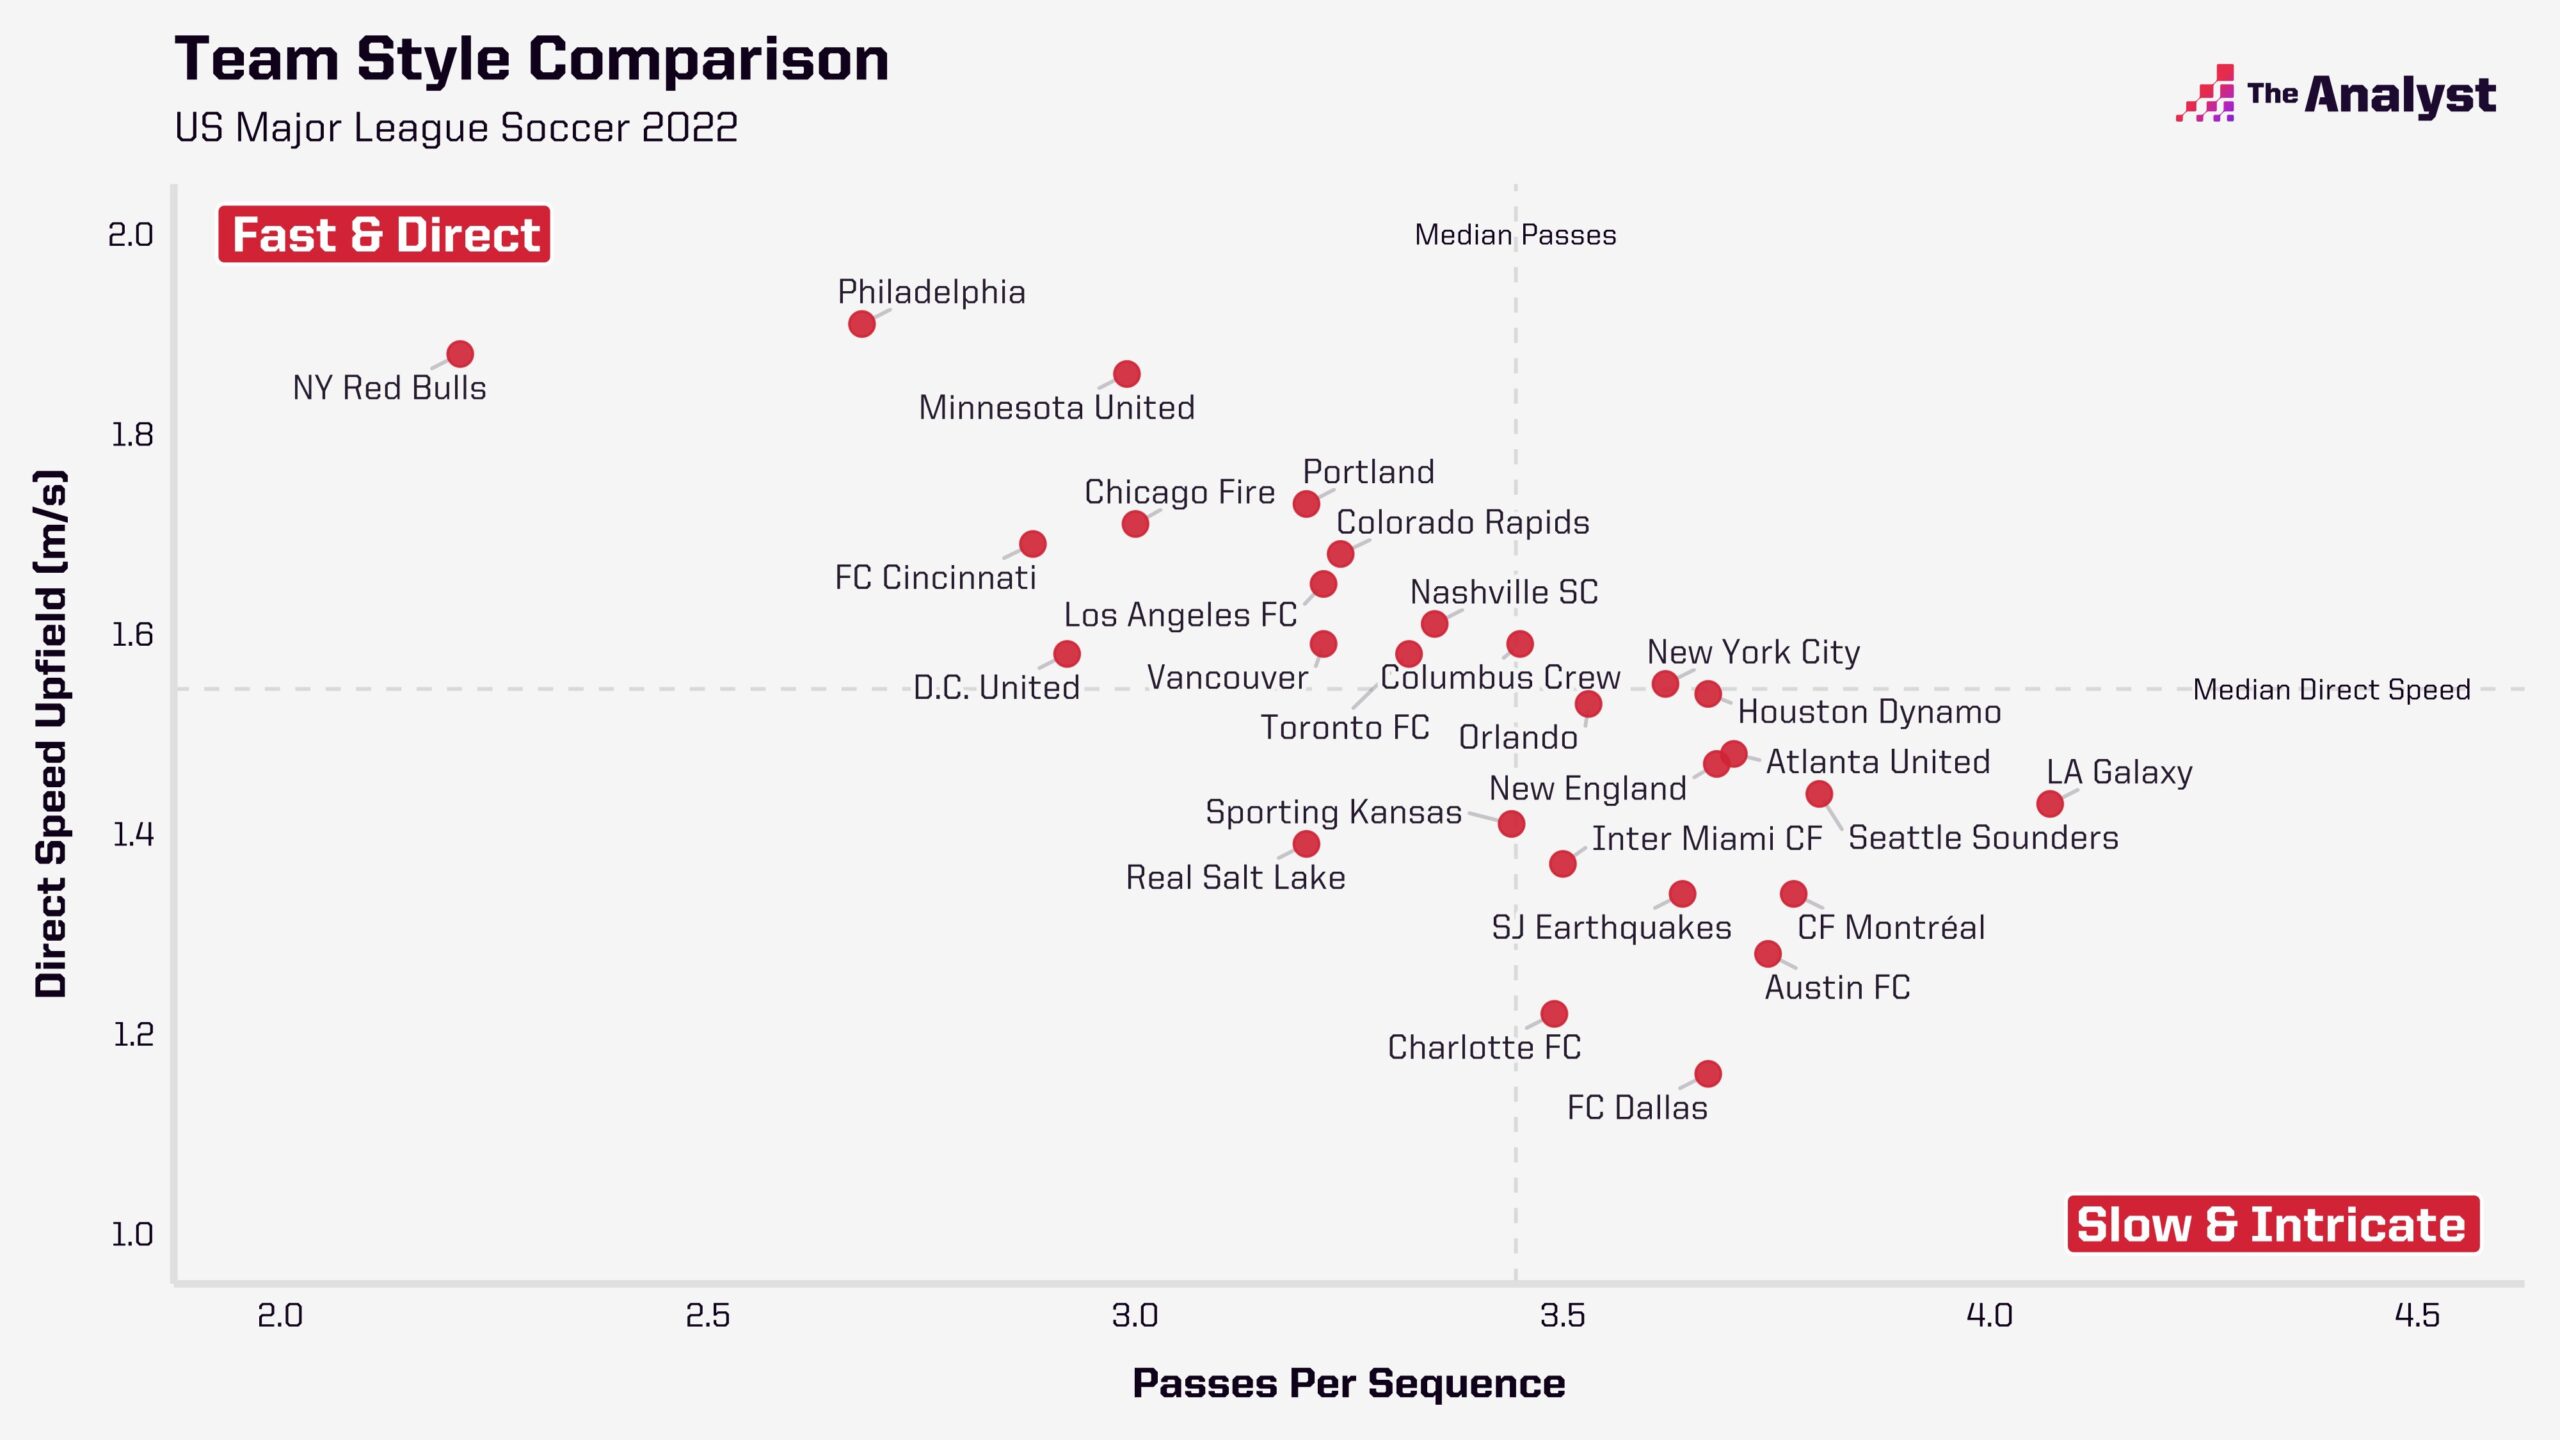
The Eastern Conference champions were the most direct side in MLS in 2022. Their median average direct speed (meters per second progressed upfield in open-play sequences) of 1.91m per second.
It shows how quickly they arrive in attacking positions, which is likely to contribute to the high average xG per non-penalty shot, mentioned earlier, as the speed of their attacks gives defenders less time to settle and less time to organize themselves following a turnover.
The Union also have the second-lowest average passes per open-play sequence (2.7), behind only the Red Bulls (2.2) – more evidence of their direct, urgent attacking style.
Their average open-play sequence time of 7.2 seconds is also the second-lowest in the league this year behind – you guessed it – the New York Red Bulls (5.8 seconds) and overall, they have had just 144 open-play passing sequences of 10 passes or more which is the second-lowest behind you-know-who (83).
When this almost frantic attacking play is combined with high pressing, you get a team that’s not very pleasant to play against. The Union can lure teams into a false sense of security in possession, before hitting them on the counter; or they can force the issue high up the pitch during turnovers, or as teams attempt to play out from the back.
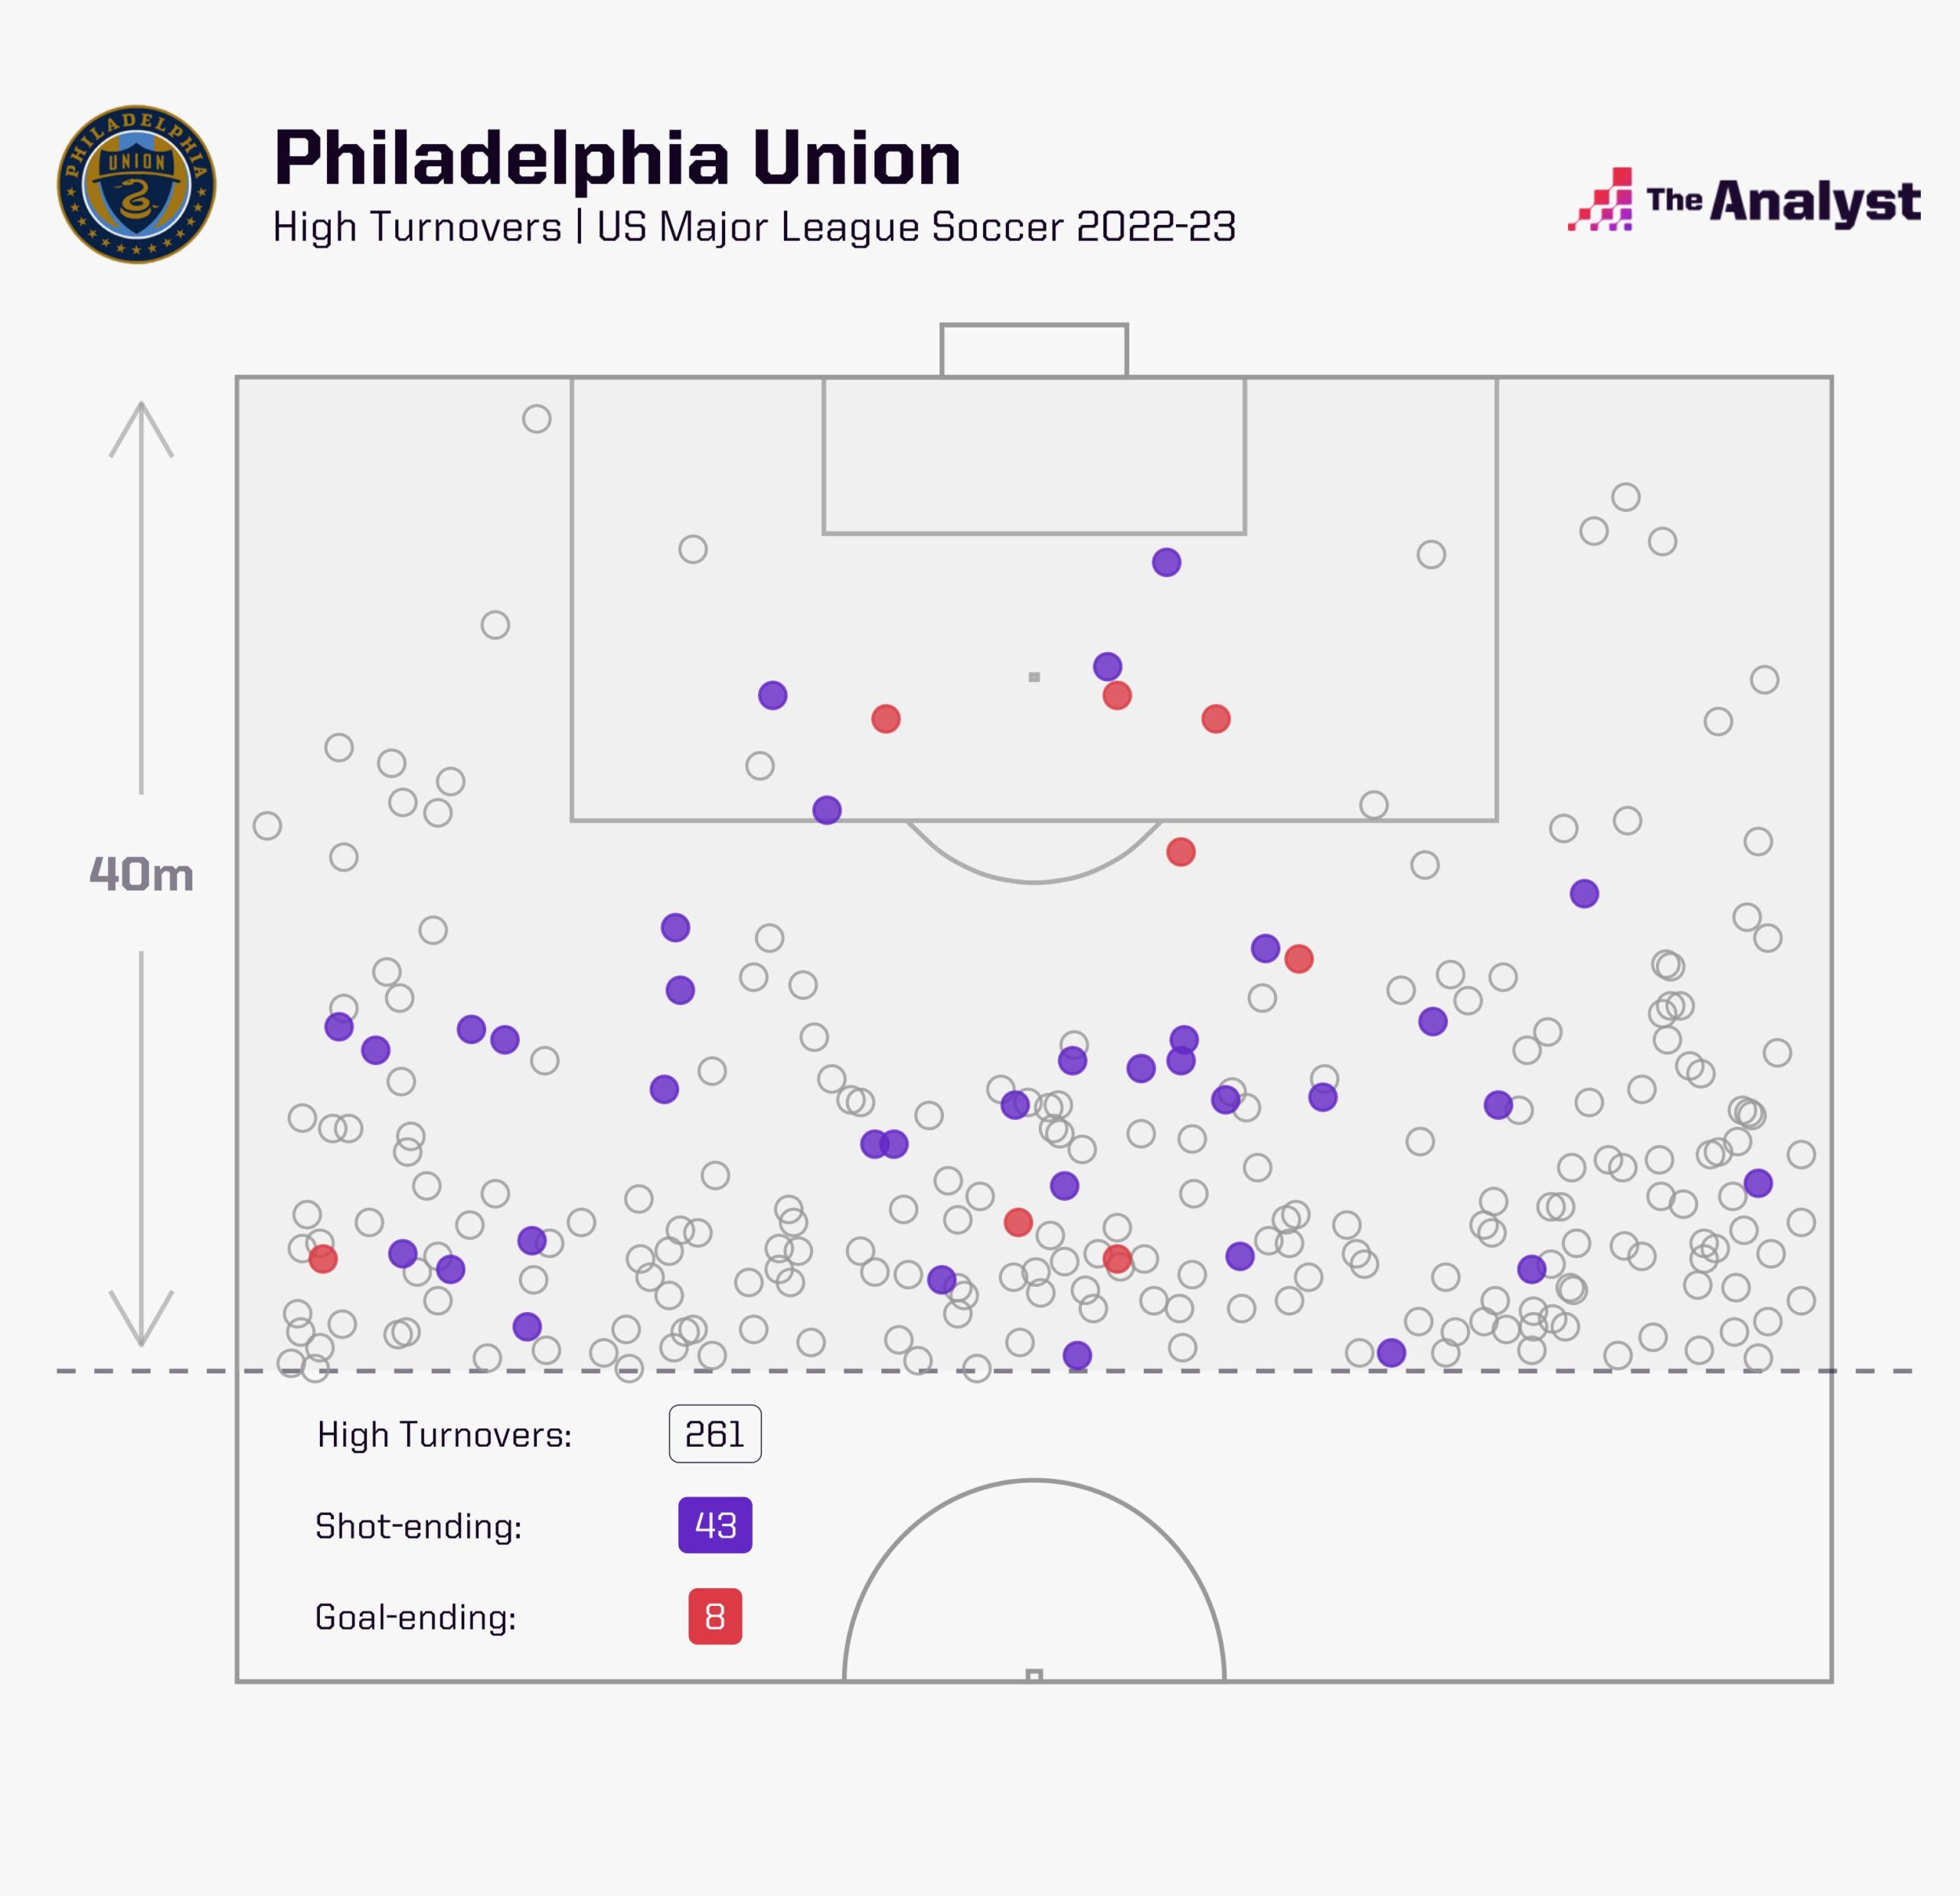
The high turnovers metric measures the number of open-play possessions that begin 40m or less from the opponent’s goal. The Union have scored eight league goals following high turnovers this season, with only Thursday’s conference semifinal opponents FC Cincinnati registering more with 11.
The graphic below shows the Union’s high turnovers and which of them led to a shot or a goal:
When measuring pressing, the passes per defensive action (PPDA) metric can be more useful than pressing totals, as even teams who dominate possession can press a lot, they just do it less in total because they don’t have as much defending to do.
Despite their low possession count numbers, this is still a good way of measuring the Union’s pressing more fairly in comparison to other teams, as opposed to using total pressures applied. This is because PPDA measures the number of opposition passes allowed outside of the pressing team’s own defensive third, divided by the number of defensive actions by the pressing team in those same areas. It’s an average based on out-of-possession actions, rather than a total. The defensive actions included are fouls, tackles, interceptions, challenges and blocked passes.
The Union’s PPDA is 11.1 which is the sixth-fewest passes per defensive action allowed in MLS.
This demonstrates that even though they have phases of the game when they sit back and let the opponent have the ball, they are still one of the most active teams in MLS when it comes to pressing.
Though counter-pressing itself is an effective playmaker, teams still need players with the control, technique and composure to take advantage of that small window of time when there is space to exploit.
The front two of Uhre and Carranza, with Gazdag just behind them, are the obvious candidates for such attacking production, and the attacking sequence involvement graphic below shows their high involvement in shot-ending sequences.
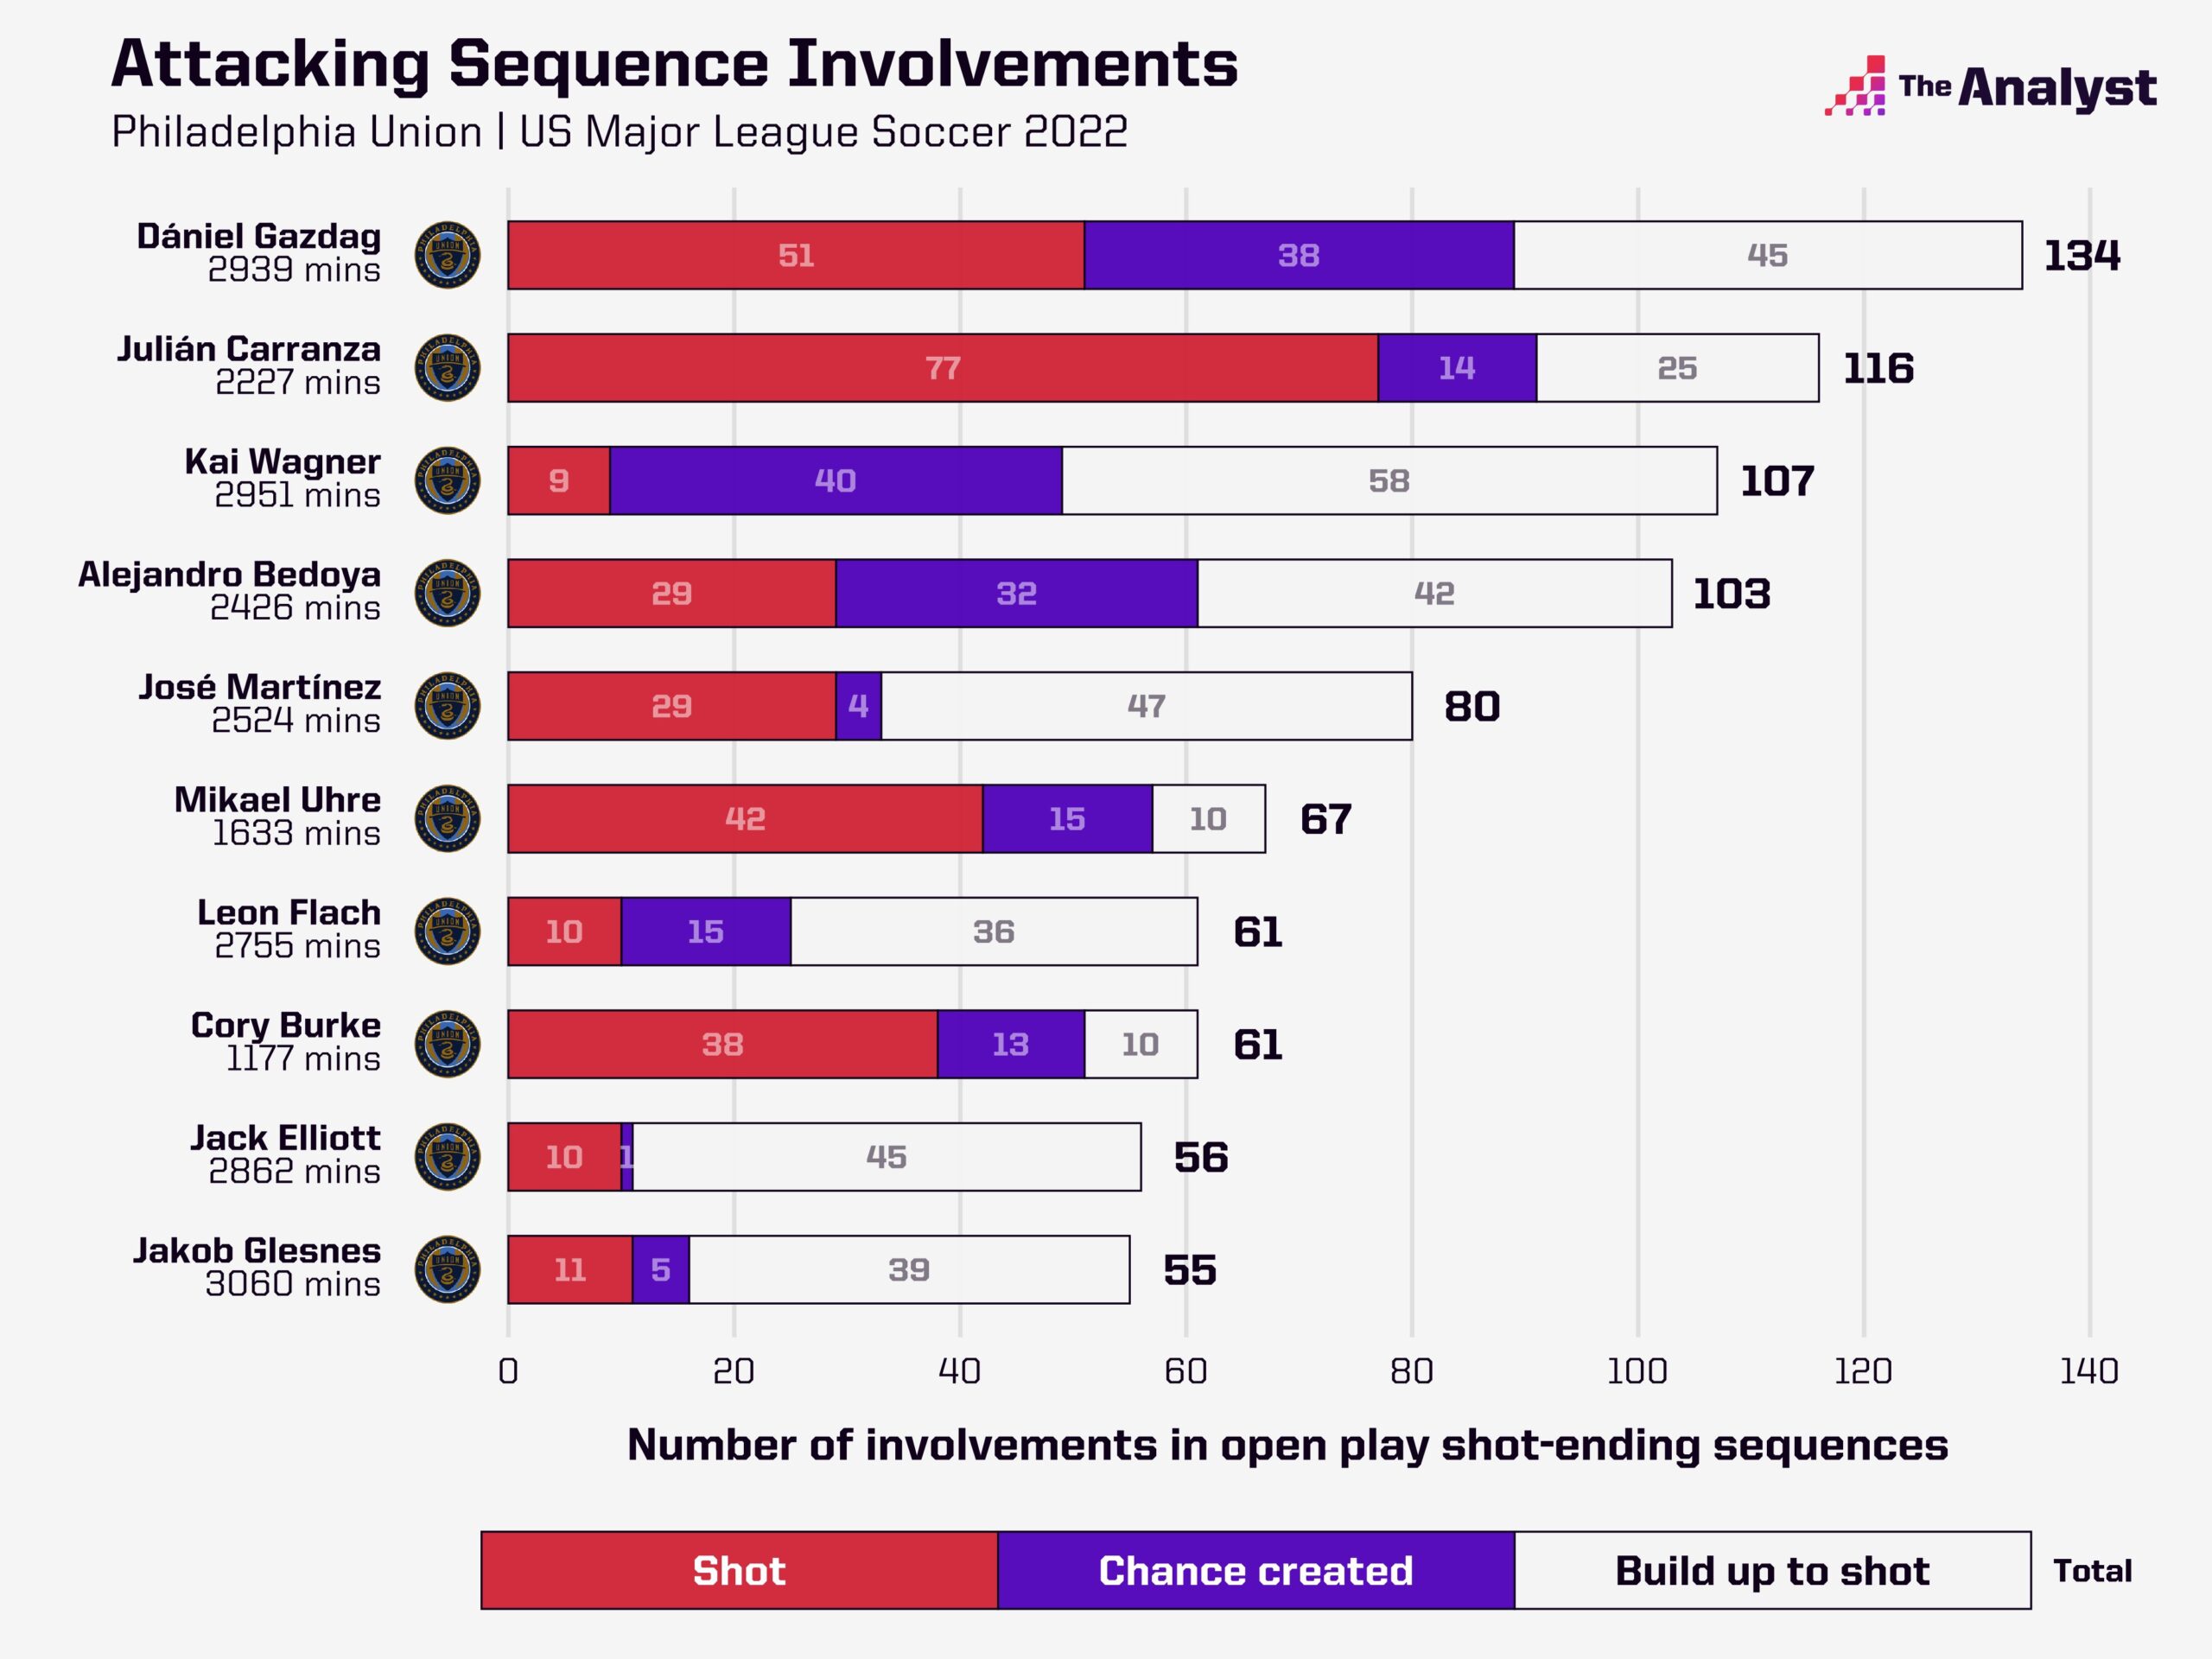
The names of Alejandro Bedoya and Kai Wagner also crop up, and both have played key roles for the Union this season. Cory Burke has also contributed as the backup or relief striker for the main two.
Bedoya brings experience and game smarts to the team. At 35 years old, he knows MLS inside out and can help new or younger players settle into the rhythm of the club and the league, while also contributing considerably himself.
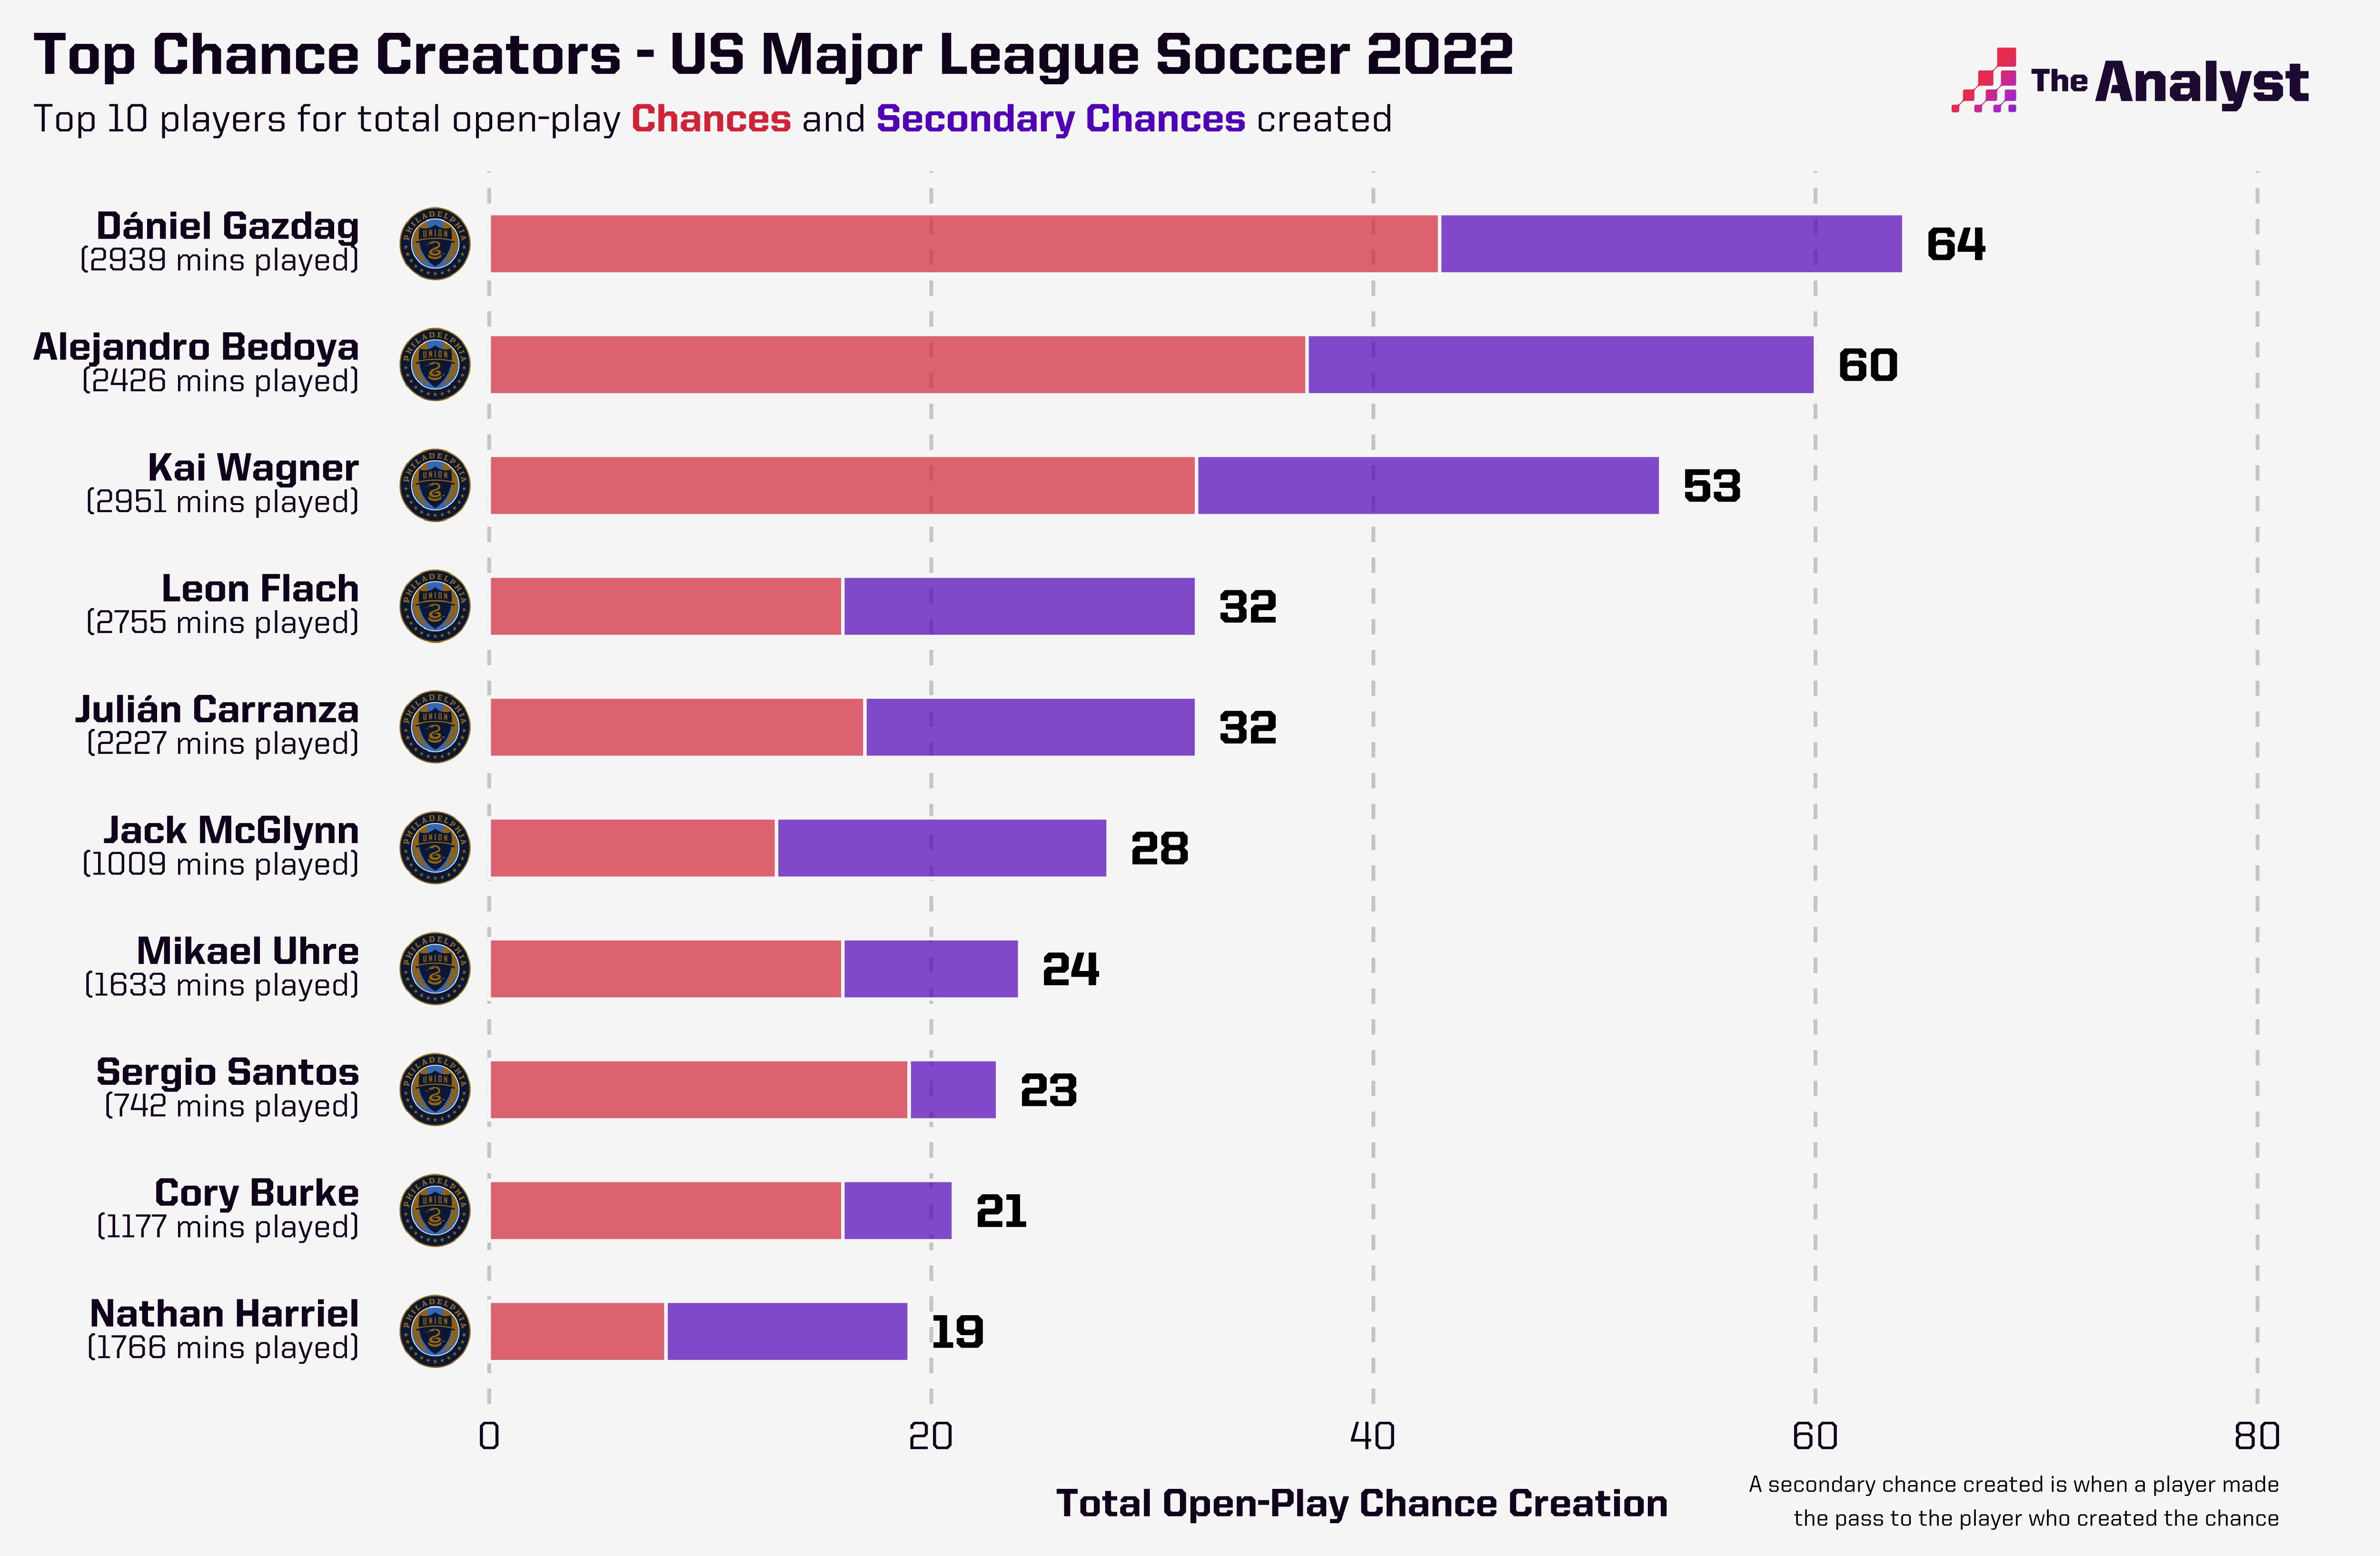
Wagner, meanwhile, has been one of the standout players in MLS this season and is one of the favorites for the Defender of the Year award, though any such recognition would not solely be because of his defensive work. The above graphic shows the left-back’s chance-creating contributions, while the one below shows he is up there with attacking midfielders Gazdag and Bedoya in terms of total chances created.
Having already mentioned some players, it feels unfair not to list every player to have played a part for the Union this season, such is their team effort.
The wonderkid playmaker Jack McGlynn, hard-working harrier Leon Flach, reliable defensive midfielder José Martínez, and a rotating pair of right-backs consisting of impressive homegrown prospect Nathan Harriel and much-improved Cameroonian Olivier Mbaizo all deserve a mention.
It’s a team thing, a tactical thing, with difference makers in both boxes that made the Union arguably the best team in MLS in 2022. It remains to be seen whether they can keep that over-performance both in attack and defense going into the often-unpredictable end of season playoffs, but they’ll certainly give it a good go.
Enjoy this? Subscribe to our newsletter to receive exclusive content.