A vital aspect of Opta’s suite of cricket outputs described in our previous explainer blog is to realistically simulate the remaining deliveries of a match to generate win probability and score predictions. Key to doing this well is to accurately predict the likelihood of each outcome for any delivery in cricket, where context surrounding that ball is considered.
For example, as a casual observer of cricket, we know that the quality of the batter and bowler would both interact to change the likelihood of a wicket, with a tailender far more likely to be out for a given ball than a top-order player. However, in addition to player quality, we must consider information such as required run rates, balls faced by the batter and many more to more accurately predict what we expect to happen on the next delivery.
To accurately predict this, we developed our Next Ball Predictor model, which forecasts the probabilities of various outcomes of the next (legal) delivery across both men and women’s domestic and international T20, One-Day, First-Class and Hundred cricket.
Next Ball Context
To accurately predict the next ball outcome, our model requires a detailed description of the delivery context. We can aggregate our understanding of the current situation into two groups: pre-game knowledge, and in-game knowledge.
Pre-game knowledge utilises historic information to create an understanding of how we expect players and the pitch to perform. This would include details such as home field (or country) advantage along with historic player and venue tendencies.
To describe historic player and venue performance, we could naïvely look at metrics such as historic wicket and scoring rates for the players and venue involved. But this does not account for the context in which the wickets or runs occurred. Batters scoring valuable runs on a seaming wicket against a quality attack should be credited more than runs on a flat deck against a weaker bowling line-up. Similarly, if high-quality bowlers are regularly struggling to take wickets at a particular venue, then this is more indicative of a batter-friendly venue than if it were weaker bowlers struggling to take wickets on the same deck.
To account for this, we developed a hierarchical Bayesian rating system which takes all our available ball-by-ball data from international and domestic leagues and creates a standardised set of ability scores that account for the batter, bowler, venue, and match context of each historic delivery. These ratings supplement other aggregated personalised information such as proportion of runs from boundaries. In total we have six personalised ratings for each cricket format, which are standardised between 0 (worst) and 1 (best):
- batter runs-per-ball (strike-rate) rating
- bowler runs-per-ball (economy) rating
- venue runs-per-ball (economy) rating
- batter balls-per-out-rating
- bowler wickets-per-ball rating
- venue wickets-per-ball rating
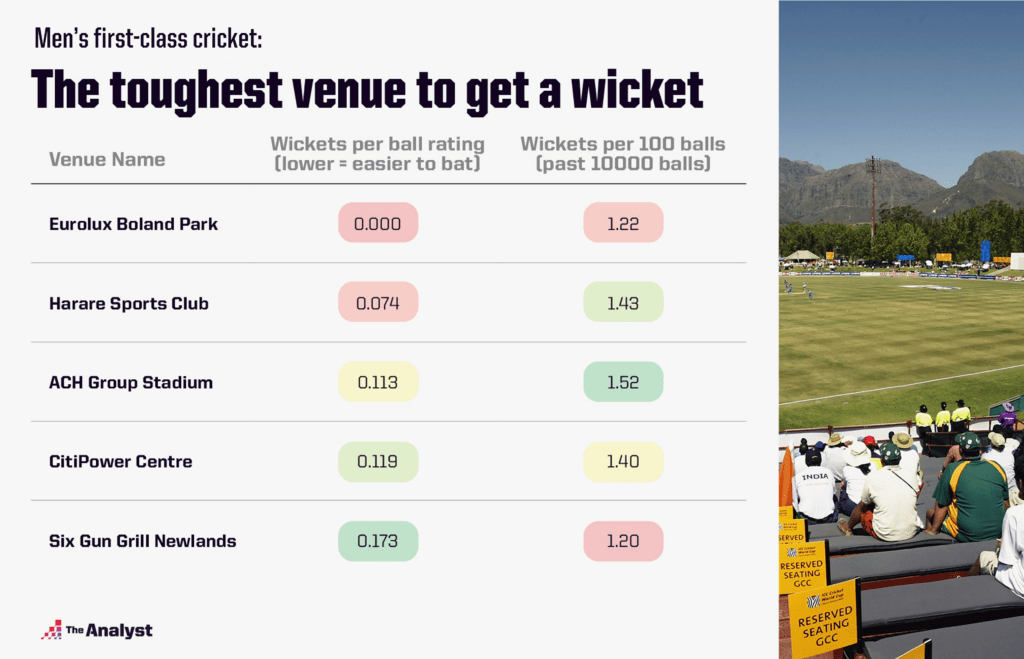
Let’s look at two of these ratings, starting with the venue wickets-per-ball rating. This is a measure of how easy or tough it has been to get a wicket at the venue being played, standardised for historic player quality and match situations. For men’s first-class cricket, according to our model, the toughest venue to get a wicket is Boland Park, in South Africa. This ground has the lowest wickets-per-ball rating, as shown in the table below.
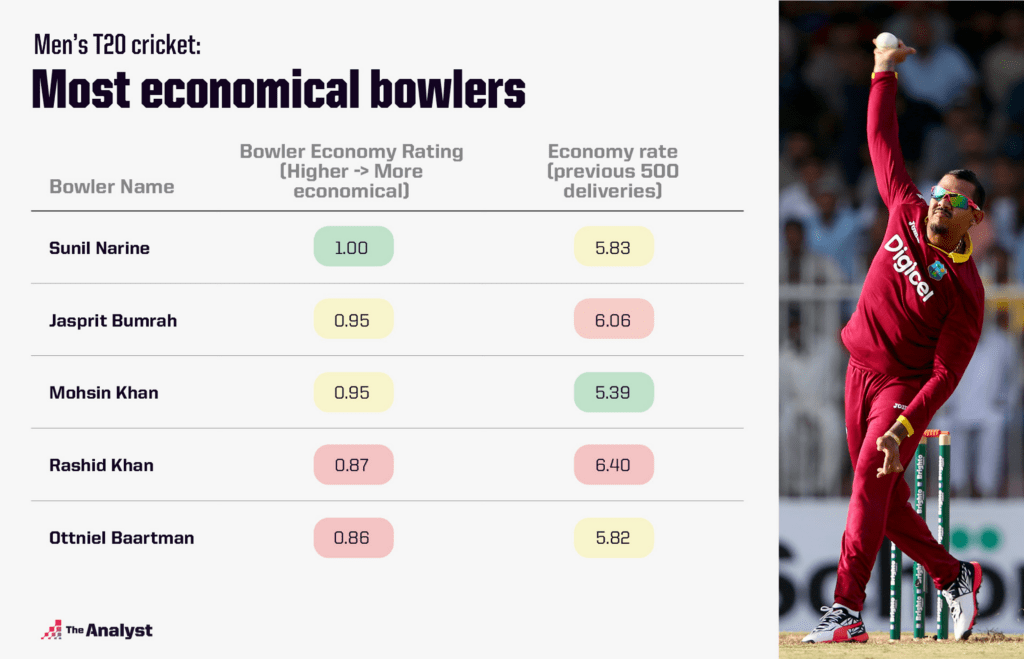
Next, let us consider the bowler runs-per-ball (economy) rating. Using this we can identify the most economical bowlers, again standardised by the historic batter quality, venue batting difficulty and game situations. For men’s T20 cricket, our highest-rated bowler in this metric is Sunil Narine, as shown in our table below. His actual economy is not the best, but adjusted for his historical delivery context, he rises to the top:
Creating these ratings is very useful for predicting the outcome of the next delivery, but this is still not enough to go on. Our pre-game information needs to be supplemented with data we collect in-game for the match we are predicting. We can further break down this in-game information into match performance and match situation as shown below.
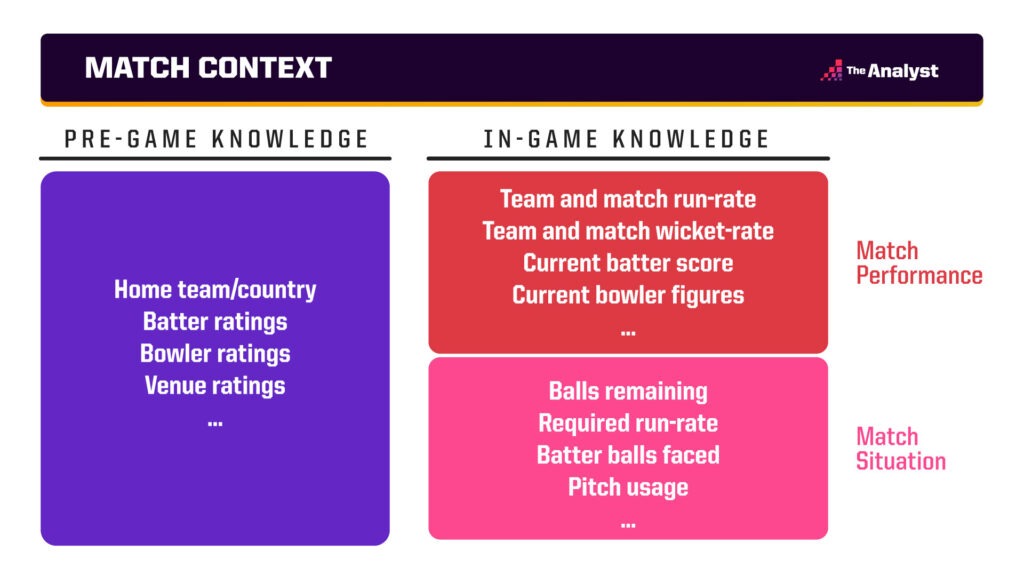
By match performance, we are looking to represent how the game has played out so far and how this compares to our pre-game expectation. Playing at a historically quick-scoring T20 ground will likely yield high run-scoring outcomes, but it does not guarantee it. Maybe a used pitch is slowing run rates for the game, which then needs to be learned by the model as play develops. Similarly, a typically low-scoring tailender might be seeing the ball like a beach ball on a particular day, so we should be altering their predicted outcomes.
Finally, this match performance information needs to be combined with the match situation. Shot choice will likely change when requiring eight runs off two balls to win, compared to eight runs off 20 balls to win! A detailed understanding of the current match situation is therefore available for our models to learn and predict likely outcomes.
Prediction Model
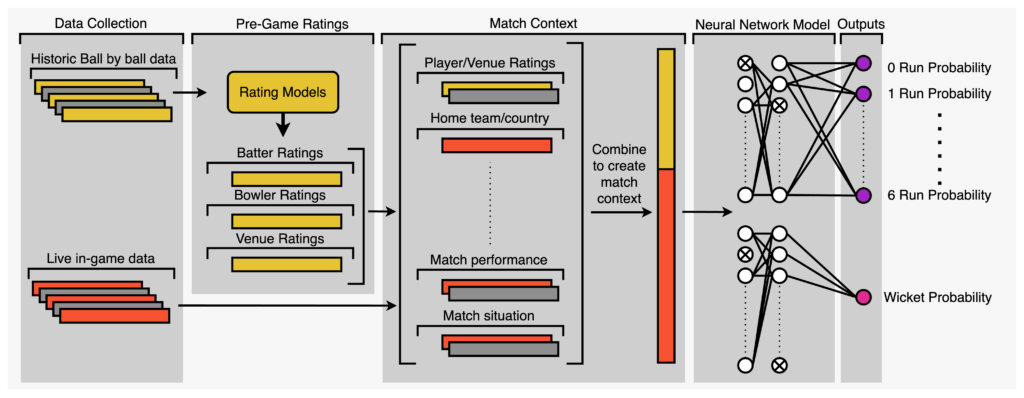
With a method to describe the match context by combining historic and in-game data, we can train a model to predict live next ball outcome probabilities. We maximised model performance using a multilayer feedforward neural network, trained, and uniquely optimised for each cricket format. The flow from data collection to prediction is shown below.
Examples
Now we can run through a couple of examples from our model and show how the next ball predictor provides a detailed breakdown of outcome likelihood, which can be compared to historical trends and aggregated down to a more digestible summary.
First, let’s look at an example from the 2022 Women’s Hundred between Trent Rockets and Southern Brave. The first innings saw the Rockets stumble towards a below-par total of 88/8, regularly losing wickets and struggling to score runs quickly. Our next ball predictor considers this first innings performance by using information such wickets and runs-per-ball rates and then combines it with contextual information about the chase such as required runs per ball. Below we show some of the ratings and features that feed into the prediction of the first (legal) ball of the chase, bowled by Katherine Brunt to Smriti Mandhana. The predictions are compared to the historic average likelihood of each outcome for the Hundred Women’s competition (measured by the pink bars).
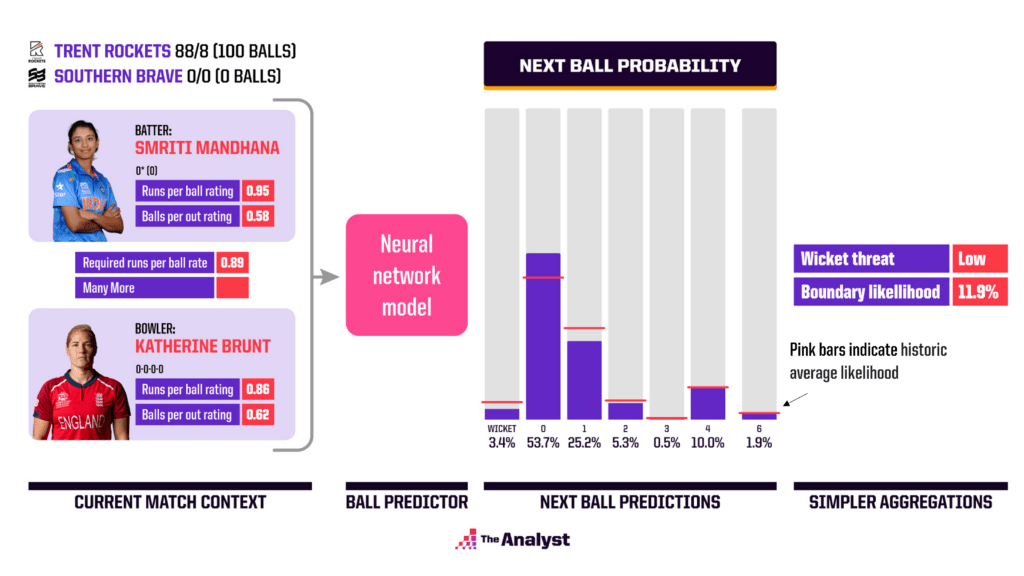
This example predicts a somewhat middling probability for a 4 or 6 (10% and 1.9% respectively), whereas the wicket probability is well below average at 3.4%. A dot ball (0 runs) is predicted as the most likely outcome at an above-average probability of 53.7%. We can produce a simple summary of the predictions (far right panel) to highlight the key takeaways: namely a low wicket threat and a moderate boundary likelihood of 11.9%. In this instance, Mandhana did in fact drive Brunt for 4, starting what was a simple chase for Southern Brave.
Now let us look at a very different match situation, in this case late in England’s struggling chase against South Africa in their 2022 T20 series. Having been set 208 to win, England had moved to 148/8, with Chris Jordan on 5* (3) facing the economical Lungi Ngidi (2.1 overs, 10 runs for 0 wickets). With a required runs-per-ball rate of 2.6, Jordan needs to hit out without being set himself.
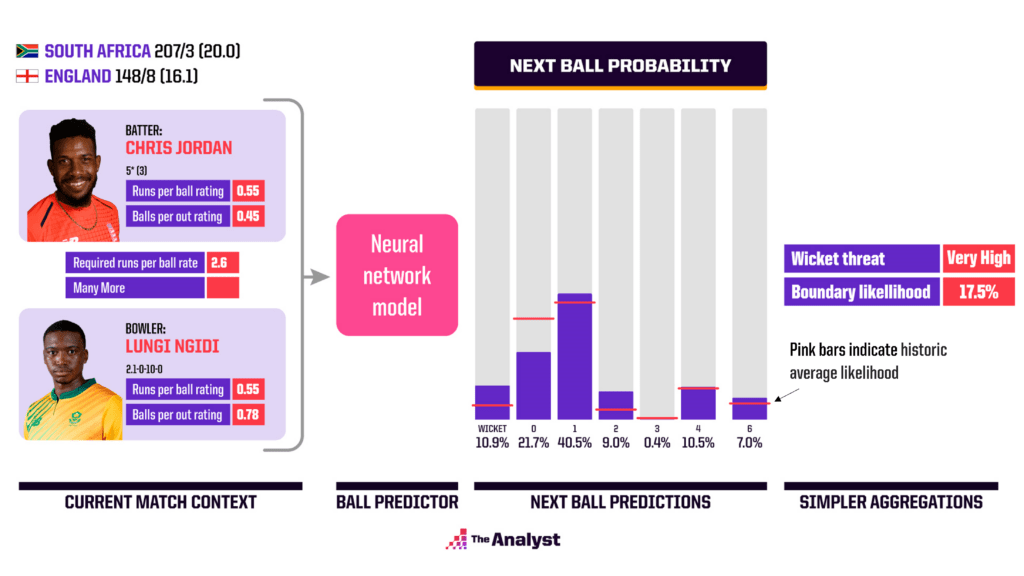
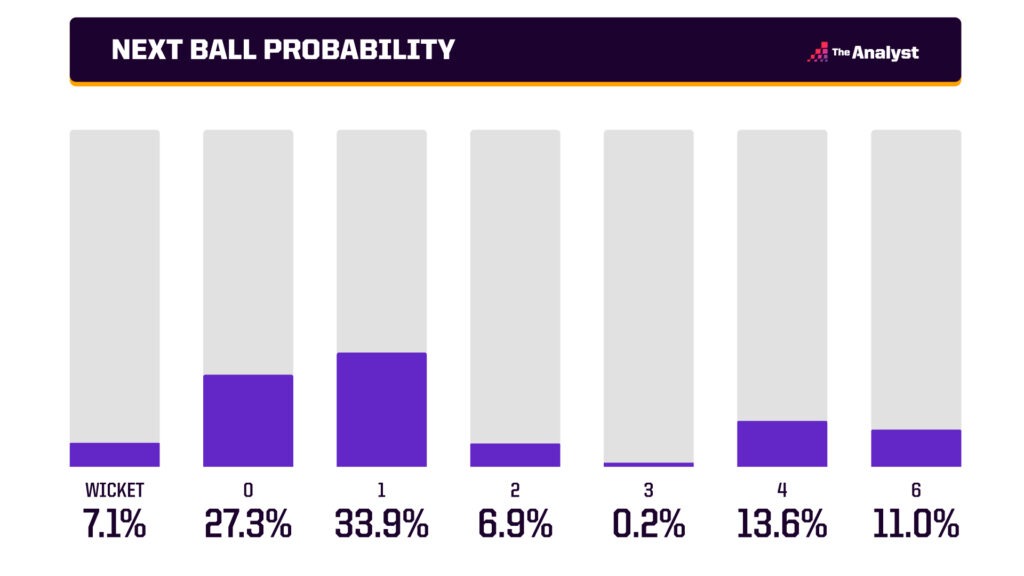
The danger in this forced attack is reflected in the predictions of the next delivery. We can again compare the predictions with historic averages for men’s T20 cricket using the pink horizontal lines, showing that the wicket likelihood of 10.9% is more than double the historic average of 5.4%. Furthermore, the boundary likelihoods are relatively high, but not as high as you would hope given the match situation. This is primarily due to the fact Jordan is not set, combined with the fact he is up against a good bowler in Ngidi who has bowled well so far and has a decent, if not exceptional, runs per ball rating himself.
The summary in the far-right panel reflects this, showing a very-high wicket threat and a high 17.5% chance of a boundary. Certainly, a high likelihood of chaos! In this case, the next delivery was indeed a wicket as Jordan was left with no choice but to attempt a slog and was caught behind.
The Next Ball Predictor model provides live insights that highlight key moments during a wide variety of cricket matches, from tricky opening mornings of a Test match to tense final overs of a T20. These predictions are not just useful in providing an understanding of what we expect to happen in the next ball of the match but can also be used to simulate the remaining deliveries within each game. This enables us to utilise the Next Ball Predictor model to power other live predictions, such as win probabilities or player and team score predictions.
Enjoy this? Subscribe to our mailing list to receive exclusive weekly content.