
We’re excited to introduce our new and improved NBA Draft model and its sliders, which enable us to highlight different assortments of players catered to certain draft traits that matter most to an individual person and/or franchise.
Essentially, what the sliders are doing is allowing for flexibility in weighing the most important factors in a player and then ranking the draft-eligible players by comparing the draftees to how current or former NBA players performed in college.
First, we mentioned “draft traits.” Then, “important factors.” But what are those exactly?
Overall, we measure 14 different areas of the game, from a player’s physical profile to numerous rate-based statistical inputs. These are purely on-court comparisons and don’t include any factors regarding mental makeup or any other off-court items that are of significance to NBA teams.
With that said, here are the different factors that comprise our model:
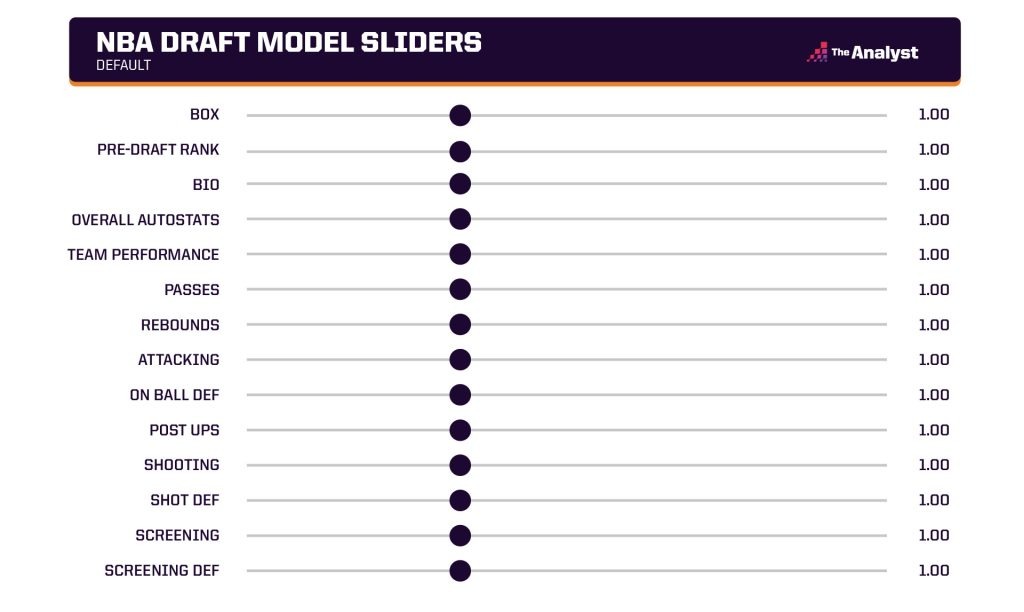
- Box: This first one refers to box score data. Most of the numbers here are per 30 minutes to create consistency between players. This goes beyond just points, rebounds and assists, and calculates some more advanced box score numbers that are easy to derive from a standard box score, like rebound percentage (which measures how often a player pulls down a rebound while they’re on the court).
- Pre-Draft Rankings: This is essentially a consensus big board. How do industry wide “experts” view a player’s ranking entering the draft?
- Bio: A player’s measurables: height, weight, age and position.
- Team Performance: A measure of how a team performs at a micro level while a player is on the court. This isn’t wins and losses, but rather a team’s points per chance on offense and defense. While this factor does not include any information about how a team performs with the player in focus on the bench, this metric does include rankings like RPI and SOS, so the model does learn and value performance dependent on the opponent when finding similar players.
- Passes: This is the capture of all the passes that a player made, including passes that turned into assists, led to a shot opportunity, or even a free throw.
- Rebounds: Here we measure how often players were in position to get a rebound, how often they got said rebound, and whether the rebound was contested or not. This also includes a location dynamic, highlighting whether a player is, among other things, boxing out or crashing the boards.
- Attacking: There are many different situations in a game in which a player is attacking during an offensive possession. Whether it’s in isolation, a pick-and-roll as the ball handler, a cutter of an off-ball screen, in transition, or as the recipient of the ball in a dribble handoff, a player and team can be either efficient or inefficient in these scenarios. This is what this component calculates, in addition to the frequency that a player is in “attack mode.”
- On-Ball Defense: The exact inverse of our attacking element, this is how you do as a defender when an offensive player is attacking you.
- Post-Ups: The same efficiency and frequency metrics used in attacking, this highlights only post-up situations – both offensive and defensive.
- Shooting: The section with the most ingredients, shooting includes the frequency of different shots (catch and shoot vs. off the dribble) and the location of a shot, whether it’s midrange or behind the arc. A unique component of shooting that is included is whether shots are contested or uncontested and a defender’s influence of a shot, enabling an evaluation of how heavily a player is contested on average while shooting a 3-point shot, for example.
- Shot Defense: The opposite of the shooting metric, all the same computations that happen for a player in an offensive situation are also applied to the player in the defensive scenario.
- Screening: Events that happen when the player in focus is the screener. This includes ball screens, off-ball screens and dribble handoffs for the player who hands off the ball. How efficient is the ball handler, the screener, the team, and how often do these moments occur?
- Screen Defense: The inverse scenario, highlighting situations in which the defensive player is the man guarding the screen.
- Overall AutoStats: This is the incorporation of our AI-enhanced body recognition that enables capturing where a player is at any given moment on the court. This metric is an amalgamation of all of the components listed above except for “Box,” “Bio,” and “Pre-Draft Rankings.”
With so many different factors that go into the evaluation of a prospect, what matters most to you will be different than what matters to someone else, whether it’s just for an evaluation of prospects in creating a big board or two different franchises valuing different areas.
However, for everything listed above, there’s one final crucial determination to be made. When? Are you a team that’s in contention and cares more about how a rookie might perform this season? Or is yours a franchise amid a rebuild and therefore it’s more important how your prospect will perform in three or four years?
We have the ability to set the DRIP (a projection of a player’s contribution to a team’s plus-minus per 100 possessions) from Year 1 to Year 6, depending on what point in the development process you want to forecast.
And finally, just as a reminder, the most important aspect is understanding that these sliders don’t necessarily deliver player rankings. Rather, the model finds the strongest correlations between players and turns that comparison into a DRIP rating. The final rankings used in this case are a player’s projected DRIP.
Stats Perform’s Matt Scott contributed. Graphic design by Matt Sisneros.
Enjoy this? Subscribe to our mailing list to receive exclusive weekly content.