The past decade has been kind to full backs. They’ve gone from the least fashionable position to one that can be anything – classic defender, modern wide-playmaker, dynamic overlapping winger… even pseudo-central midfielder. Let’s take a dive into the past 10 seasons of Premier League data to understand how full backs have evolved and identify some standout observations from this season.
(Before we get into things, a bit of housekeeping. Unless wing back is explicitly mentioned, full back is used as a catch-all term, encompassing those who play a traditional full back position as part of a back four and those who play wing back as part of three or five-at-the-back systems.)
The Evolution of the Full Back
General perception is that full backs have shifted away from a defensive focus, now playing higher up the pitch and contributing more offensively. But is that actually true?
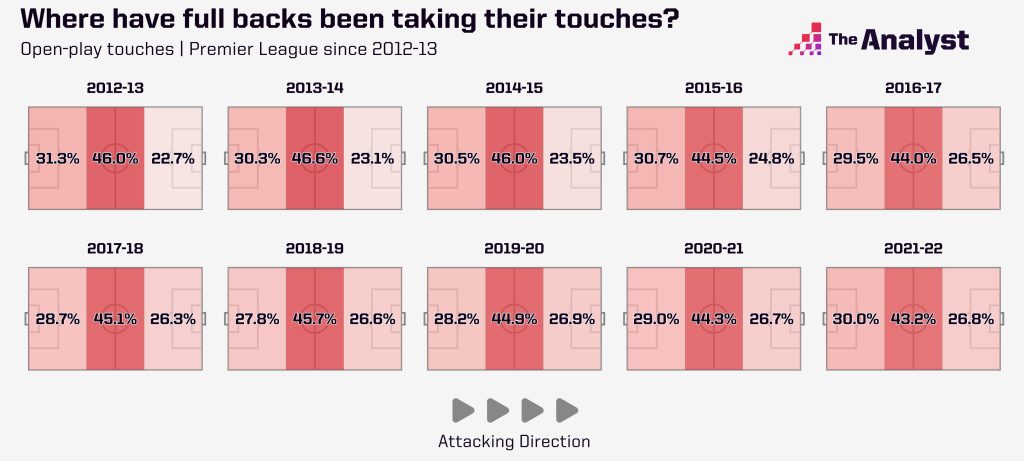
Full back involvement in general play has in fact remained steady since the 2012-13 season, with at least one full back consistently involved in around 54% of open-play sequences and taking close to 30 touches per 90. However, the nature of their involvement has changed.
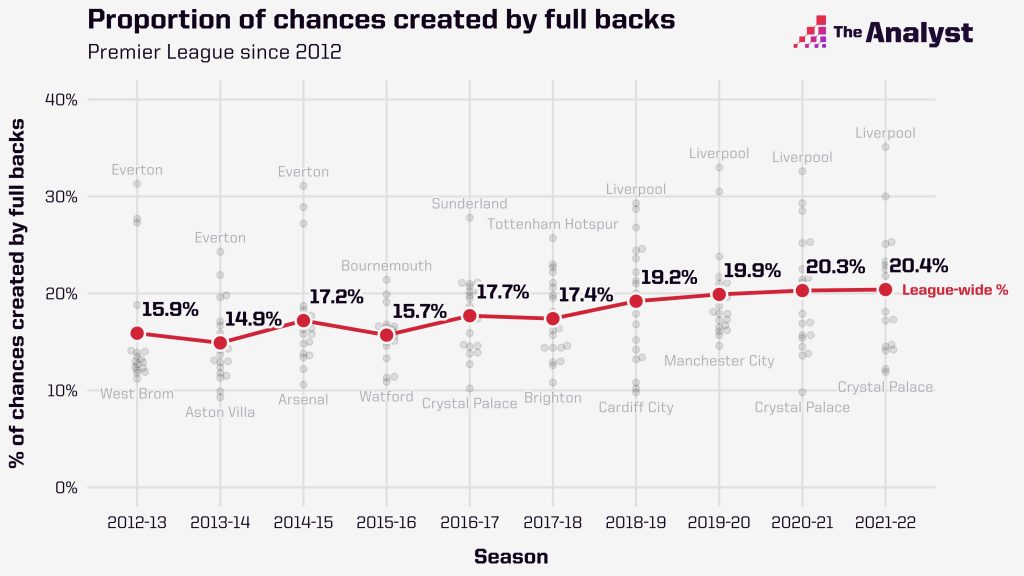
The proportion of a full back’s touches that take place in the attacking third has gone from 22.7% in 2012-13 to 26.8% in 2021-22. Naturally, this shift upfield has included a greater contribution to attacking play, with full backs now accounting for 20.4% of chances created by teams – up from 15.9% in 2012-13.
If anyone is going to cross it will be a full back – they account for just over 40% of all open-play crosses attempted this season. But it’s not great news if you’re a fan of just “sticking it in the mixer”.
Teams in general have been crossing less. 15.9 attempted crosses per 90 in 2012-13 has become just 12.0 per 90 in 2021-22, a 24.5% decrease. And full backs have been a part of this – 2.9 crosses per 90 in 2012-13 is now 2.5 per 90, a 13.6% decrease.
Yet it is how often they choose to cross the ball that really shows the decline of crossing. In the Premier League this season, full backs now cross the ball only 19.5% of the time when making a pass in the final third, compared to 27.5% of the time in 2012-13.
Not everyone follows the crowd though. Let’s give a nod of appreciation to the full backs of Burnley 2014-15 and Stoke City 2012-13, who chose to cross over 42% of their passes in the attacking third. Keep it simple.
So, the typical ideas of a modern full back generally hold – they’re more attacking, creative and tend to cross less. So, how is each team using their full backs this season?
Full Backs in the Premier League 2021-22
To get a simple idea, we can first look at the average touch position of each team’s left and right back.
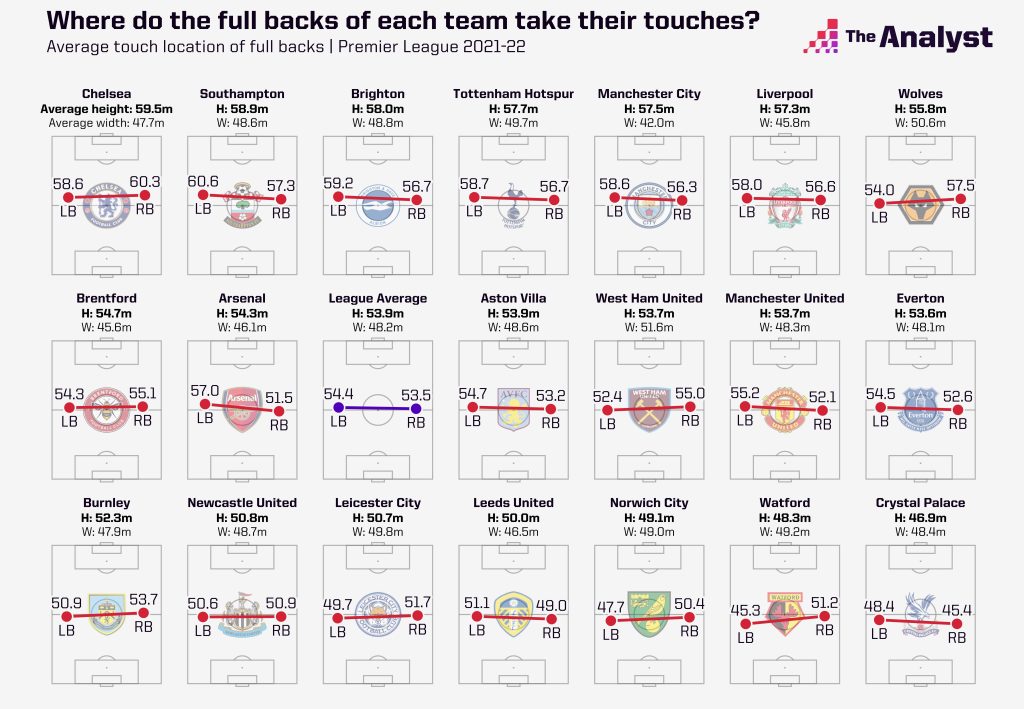
Ordered by average touch height, the above graphic gives an initial idea of how a team uses their full backs, although the tendency to play formations with wing backs should also be considered. Southampton’s second place on this list – despite playing 81% of their minutes with a back four – represents their aggressive style under Ralph Hasenhüttl. Chelsea, Brighton and Spurs all use their fair share of wing backs and this is reflected in their advanced positions.
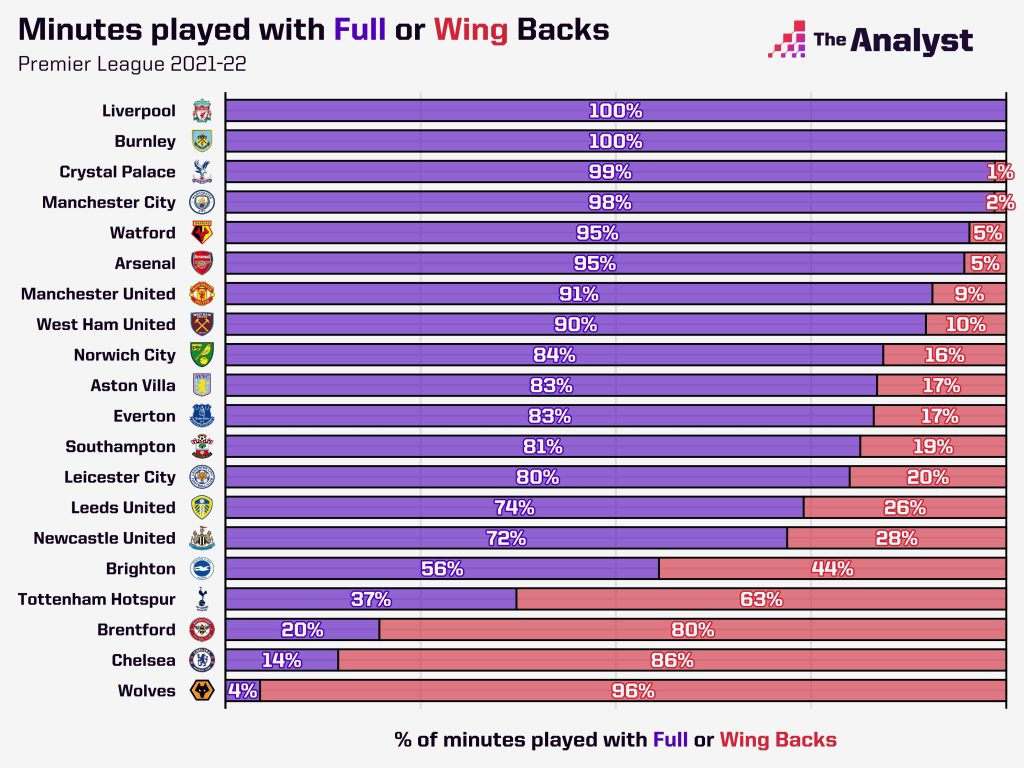
At the other end of the scale, we have Crystal Palace. There is little emphasis on their full backs engaging in advanced areas. And when we look at full back contribution to chance creation, the picture becomes even clearer. Creating just 11.9% of their team’s chances, this is the lowest of any team in the Premier League.
Liverpool’s Do-It-All Duo
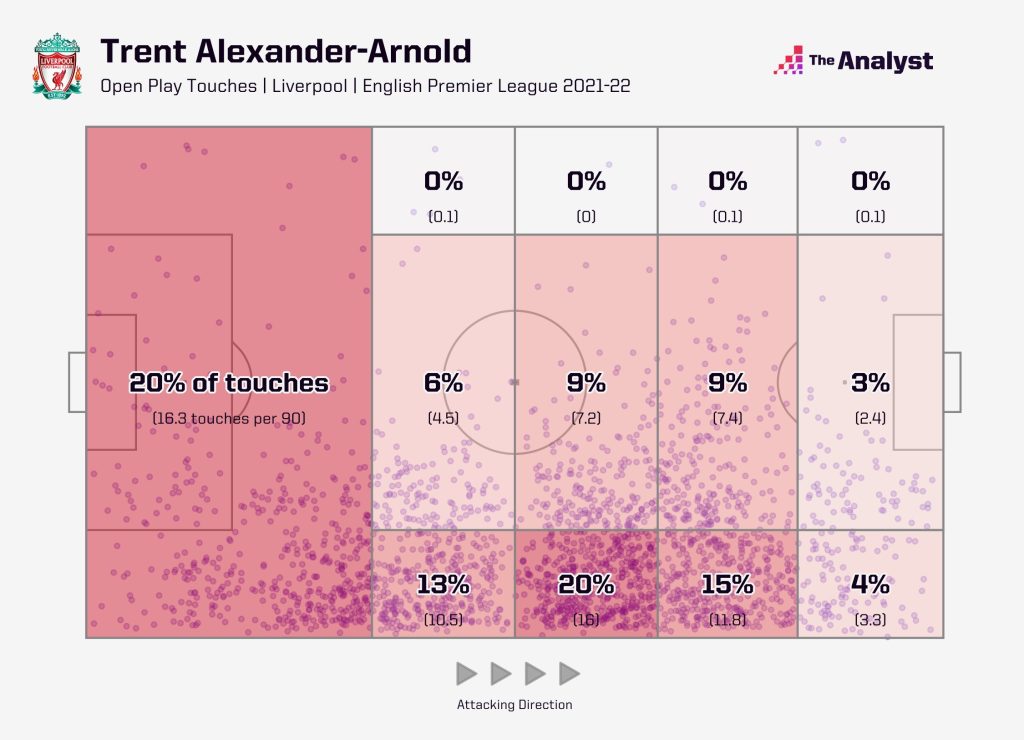
Liverpool’s now-famous duo of Trent Alexander-Arnold and Andy Robertson (with a sprinkling of Konstantinos Tsimikas) under Jürgen Klopp have come to epitomise the modern full back. A full back is involved in 61.5% of Liverpool’s open-play sequences – the second highest in the league behind Manchester City on 64.1% – and they create just over 35% of their chances – the highest of any team. Alexander-Arnold, in particular, has become notable for his presence high up the wing and into the half-space – a freedom that has allowed him to create 83 chances this season.
On top of this, they take almost all corners. 94.1% of them, in fact, which is a staggeringly high number when you realise the team with the next highest share is Newcastle with 60.4%. They also adopt an uncommon delivery strategy. The majority (73%) of their corners are outswingers, the highest proportion in the league and way higher than Wolves (50%) who are next on. Delivering outswinging corners allows the full back to stay on their natural side. For Liverpool, the full back has become an essential part of nearly every aspect of their game.
Full Backs? I Always Preferred Central Midfielders Anyway…
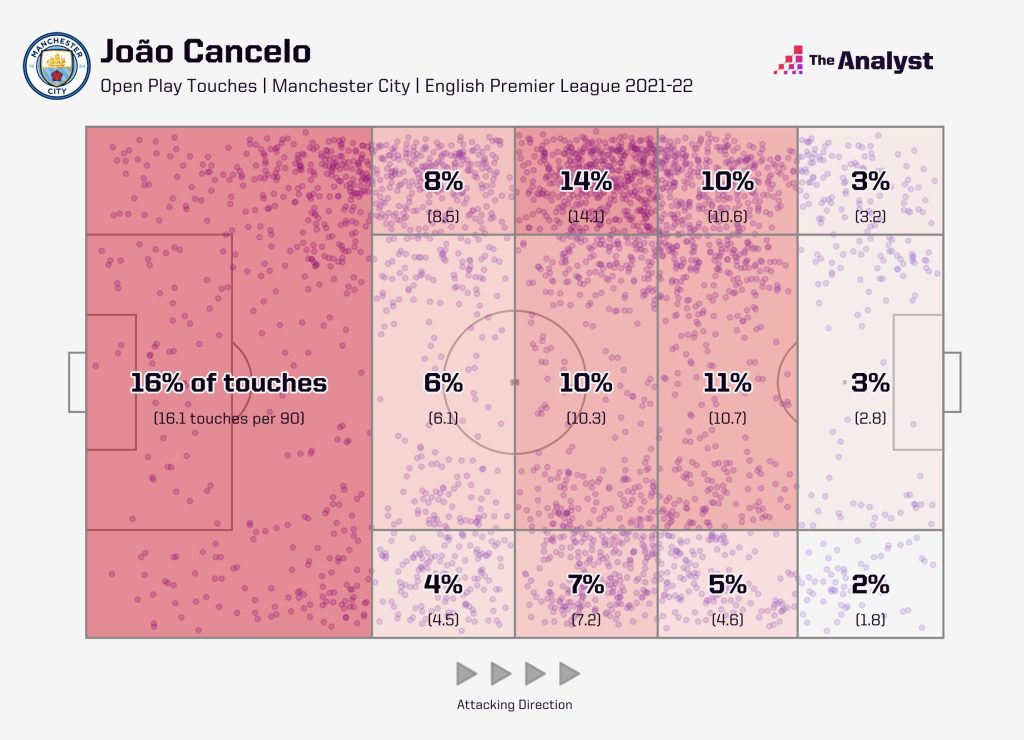
For Manchester City, the full back is a facilitator. Unlike the chance-creating machines of Liverpool, full backs only create 12% of City’s chances – the second lowest in the league. Yet, they are involved in 64.1% of City’s open-play sequences, the highest of any side. They also tend to be the narrowest full backs in the Premier League by far, with just 41.7 metres between their average positions. These full backs really look like additional midfielders.
A prime example is João Cancelo. He has been involved in 44% of City’s open-play sequences. No other player in the league can even come close to that level of involvement – Rodri is the next highest featuring in 37%. His touch locations resemble Alexander-Arnold above with a slightly greater focus on the centre and, of course, his versatility playing both on the left and right.
The Goalscorers
Some full backs have become so accustomed to attacking that they’re even having attempts at goal. This season, Chelsea’s Reece James is leading the pack with five goals. Chelsea full backs as a whole seem to have an eye for goal, the 12 goals between them are more than double the next highest of Spurs and Aston Villa (five each).
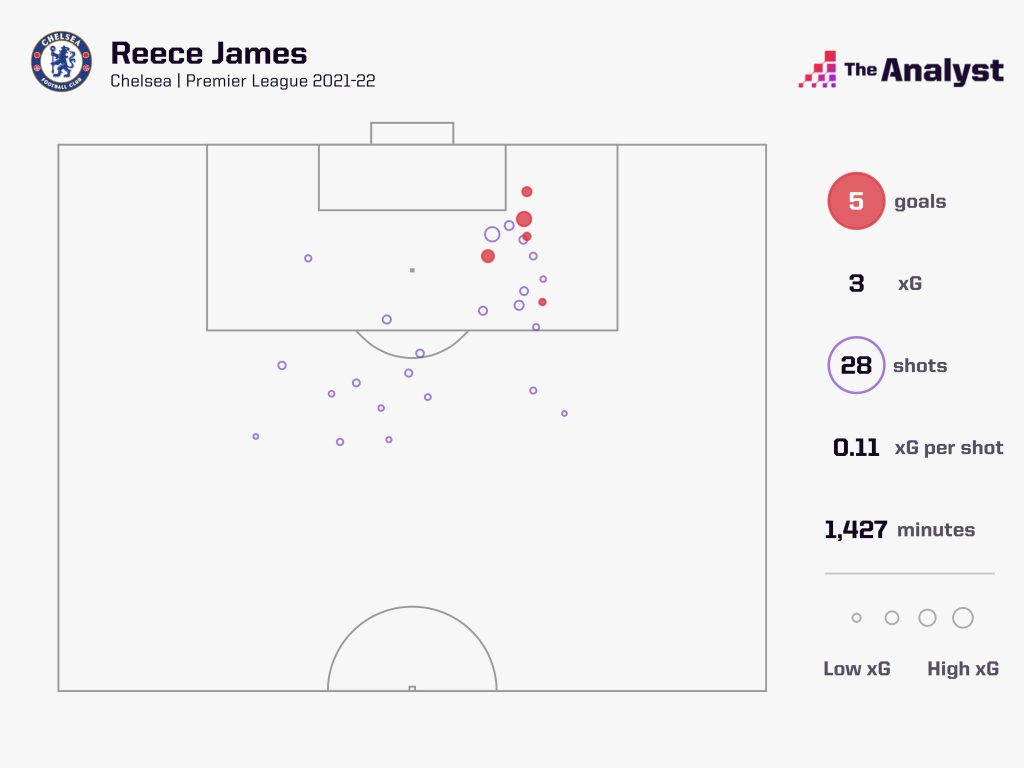
Those 12 goals have come from a total of 8.3 xG this season, so you wouldn’t expect this hot-scoring streak to continue for Chelsea but, alongside Spurs with 8.2 xG, they have cemented themselves as some of the most dangerous full backs in front of goal.
Crossing Isn’t Dead
Finally, there are those who won’t let the tradition of crossing die. In terms of sheer quantity, Vladimir Coufal (4.0), Reece James (3.9) and Cédric Soares (3.9) attempt the most open-play crosses per 90 (minimum 900 minutes played).
But what about those whose first thought is “can I whip this in?” Welcome then, Matt Richie of Newcastle United, Charlie Taylor of Burnley and Ben Johnson of West Ham. Crossing with 38.2%, 38.1% and 36.6% of their attacking third passes respectively, these are your kings of tradition. That said, they’re not quite 2012-13 Danny Simpson who crossed over half (56.8%) of all attacking third passes he attempted for Newcastle. Then again, Danny Simpson has won a Premier League and we haven’t. Who’s laughing now?
Full back has become one of the most diverse positions in football. Whether they’re advanced wing backs or part of a deeper-lying back four, crossers or possession-maintainers, each team has their own unique take on how they choose to deploy them.
Jamie Carragher once quipped that “No one wants to grow up and be a Gary Neville.” Maybe not, but there are plenty who want to be the next Trent Alexander-Arnold.
Enjoy this? Subscribe to our mailing list to receive exclusive weekly content.
Design by Matt Sisneros.