
Flash in the pan, or a genuine sustainable scoring streak? A temporary blip or a scoring malaise? How we can use expected goals to sense check whether a striker’s run in front of goal is here to stay.
Diogo Jota controls an inch-perfect clipped through ball from Trent Alexander-Arnold expertly on his chest, his first touch taking the ball across Ben White who now knows he cannot possibly touch the Liverpool man. Aaron Ramsdale rushes out and flings himself at Jota’s feet, but not before the Portuguese striker deftly dinks the ball over him into an empty net. It’s Jota’s second of the game, and Liverpool now have a commanding 2-0 lead over Arsenal in the Carabao Cup semi-final. No Mohamed Salah and Sadio Mane – they’re both at the African Cup of Nations. No problem. Jota has picked up the slack brilliantly.
With 12 goals in his 23 league appearances this season, Jota has already posted his best ever goalscoring season, after notching nine last campaign. He’s been a revelation for Liverpool since joining from Wolves, seemingly outperforming all expectations. But should we have been so surprised? Expected goals tell us maybe not…
For a full primer on expected goals, head over to our explainer page on the metric. But a quick summary is that the expected goals models (or xG) measures the quality of a chance by calculating the likelihood that it will be scored from a particular position on the pitch during a particular phase of play. This value is based on several factors. xG is measured on a scale between zero and one, where zero represents a chance that is impossible to score, and one represents a chance that a player would be expected to score every single time. For context, the average xG per shot of all shots in the Premier League this season is 0.11 – in other words, on average, each shot has roughly an 11% chance of going in.
At the player level, we can use xG to analyse whether a player’s scoring streak (or indeed scoring drought) is representative of the underlying quality of chances they’re taking. Are they scoring frequently because they’re frequently amassing good chances, or are they scoring goals from difficult situations – like a tight angle, or a wonder goal from outside the box – and therefore might not be able to sustain this? Are they getting into good scoring positions but for whatever reason, unable to convert these chances?
While we can’t solely rely on expected goals to answer these questions (xG under/over performance can be a good indicator for future performance, but we can’t make assumptions from that alone) we can use the metric to help us provide some additional context.
Which brings us back to Diogo Jota.
“We Needn’t Have Worried”: The Underperformers
Diogo Jota, Wolves, 2019-20 | Goals (7), Expected Goals (11.5), Underperformance (-4.5)
Jota’s goalscoring record in the Premier League for Wolves is pretty much the definition of good-not-great. In his first season in the top-flight he scored nine goals in 33 games as Wolves impressed after being promoted. He followed that up in 2019-20 with seven in 34, which is fine, but hardly the surface-level numbers that seemingly warranted a £41m move to Liverpool ahead of the 2020-21 season.
But dig below the surface of that final season at Wolves and it’s a different story. Jota took shots worth 11.5 expected goals. With seven actual goals, he underperformed his xG total by 4.5 goals. That may not sound like a lot, but only two players (the cursed David McGoldrick and future team-mate Roberto Firmino) underperformed by more in that season.
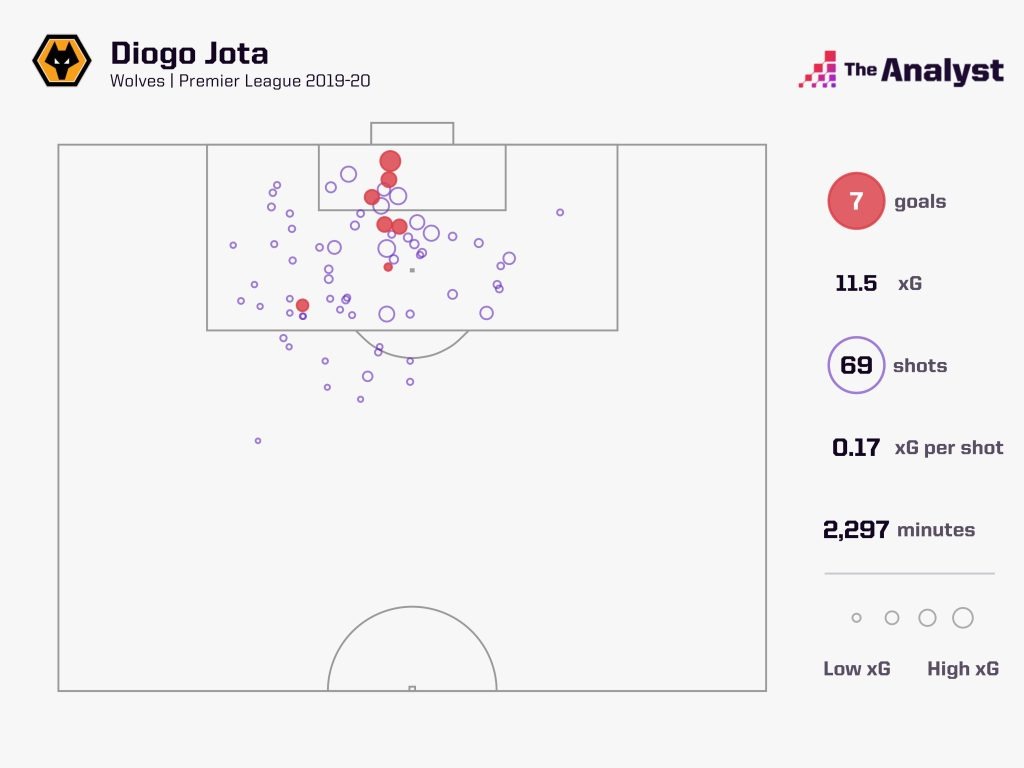
His shot map above shows a range of good quality strikes inside the box (the larger the circle, the higher the xG of that shot) that he wasn’t able to convert.
While a smaller sample of shots is subject to greater variance in performance, over 236 shots it’s clear to see that Jota scores largely in line with expectation: over his Premier League career, he’s scored 39 goals from 37 xG, so we know he performs roughly in line with where he should be.
That 2019-20 was a blip, and Liverpool pounced.
Now clearly Liverpool didn’t just sign Jota for his goalscoring prowess – he’s also a highly intelligent and diligent presser and is comfortable playing across any of the spots in their front three – but they would have definitely done their homework on his top-level numbers, which were perhaps not as high as they should have been.
Flash forward to this season and Jota is the Premier League’s second-highest goalscorer and has carried the attack in the absence of Salah and Mané.
Liverpool’s shrewdness in the transfer window has paid off once again.
Neal Maupay, Brighton, 2020-21 | Goals (8), Expected Goals (13.4), Underperformance (-5.4)
Neal Maupay’s name could have appeared multiple times here, but his 2020-21 is the pinnacle of his woes in front of goal.
It’s no secret that Brighton felt the wrath of the expected goals Gods last season. Graham Potter’s side’s underlying performances were a lot better than the actual results they saw on the pitch, their 16th-place finish coming courtesy of a dangerous combination of wasteful finishing and extreme bad luck.
Such was their tumultuous relationship with the xG metric that “doing a Brighton” became common vernacular for a team’s inability to close out games, as well as the club being memed across social media for dominating matches but still somehow managing to drop points. One Brighton fansite even launched a petition demanding the 2020-21 Premier League season be decided on expected goals rather than real ones.
Plainly, The Seagulls created lots of chances but wasted them. Their shot conversion rate was way down at 8.2% (17th worst in the league), as was their Big Chance conversion rate (32.3%, also 17th worst.)
They could have and should have, scored a lot more. Chief among the guilty parties was striker Neal Maupay, who registered an xG total of 13.4 but scored just eight goals from that (and three of them were penalties). Only Timo Werner (more on him later) undershot his xG total by more that season.
But what a difference a new season makes. The chances that were missing last year are now going in for Maupay, and for Brighton as a team.
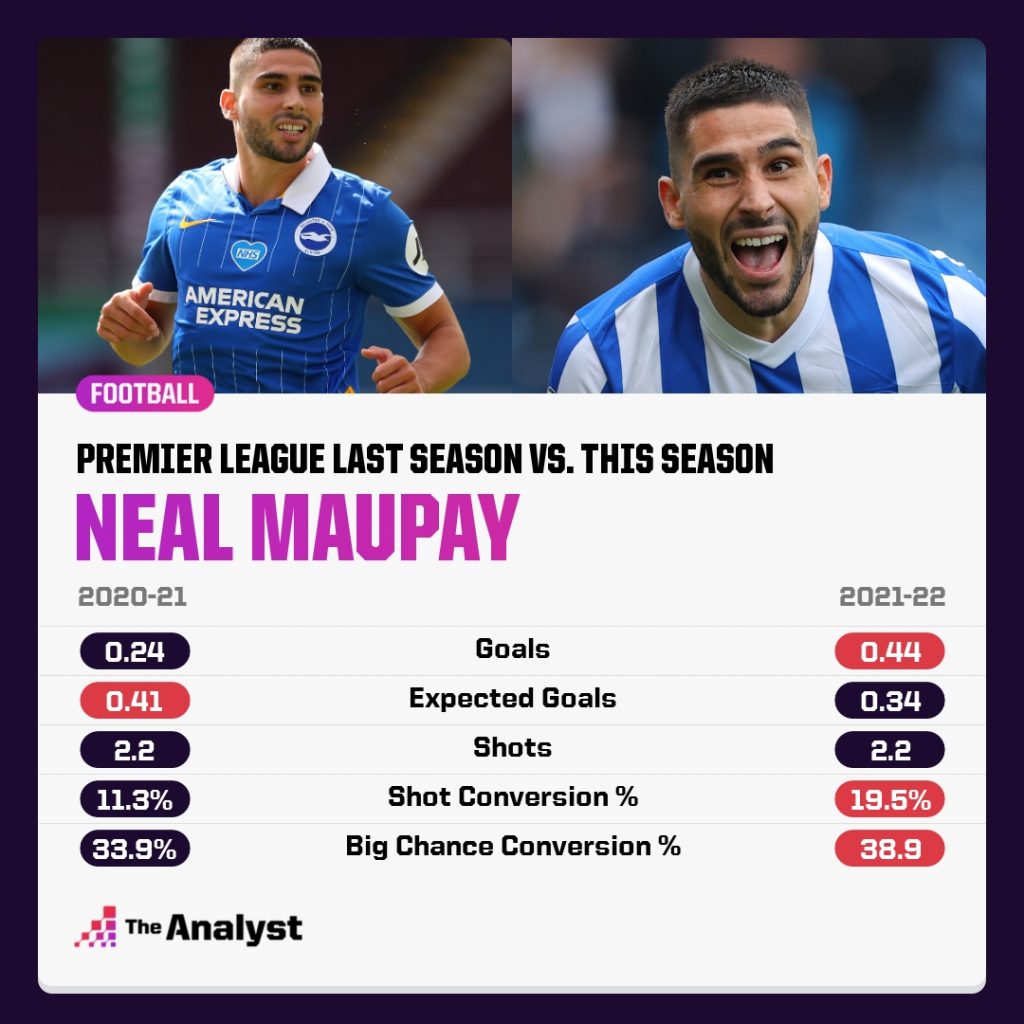
Compare Maupay’s stats from this season to last. He’s shooting as often but accumulating fewer expected goals per game. Despite that, he is scoring more frequently. The biggest difference is simply in shot conversion rates. There was just no way he could continue being as profligate in front of goal as in 2020-21.
Looking at xG, rather than actual goals, told us the real story of last year.
Karim Benzema, Real Madrid, 2017-18 | Goals (5), Expected Goals (13.2), Underperformance (-8.2)
It’s May 2018. You’re Real Madrid and you’ve relinquished your La Liga crown to rivals Barcelona. You finished third, 17 points off the winners, despite scoring 94 goals. You’re about to lose your all-time record scorer Cristiano Ronaldo, the man who scored 450 goals in 438 games, to Juventus and you’ve got [checks notes] a 30-year-old Karim Benzema to fill the void. The same Benzema who managed just five goals that season. *gulp*.
But again, look under the hood and expected goals tells us that Benzema should have scored over 13 goals that season. His underperformance of 8.2 is the biggest single underperformance of any player in La Liga in recorded history.
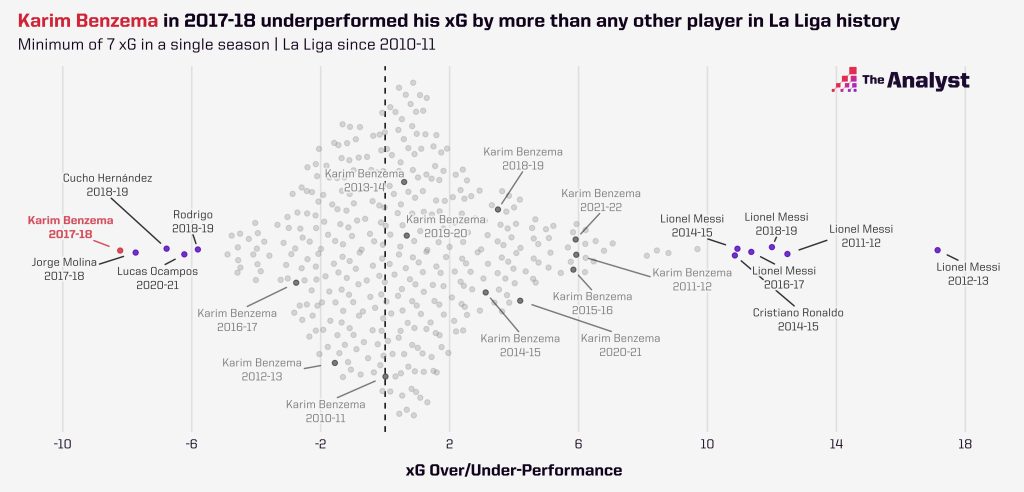
So, Ronaldo leaves. And what happens next? Benzema scores 20+ goals for three consecutive seasons, is currently on track for another 20 this season, and comes fourth in the 2021 Ballon d’Or rankings. Ok, so Real aren’t at the peak of their powers right now, but on an individual level, Benzema is perhaps in the form of his life. The Frenchman is renowned as a world-class finisher, and given that, his 2017-18 numbers were likely to positively regress.
“Hmm, We Should Maybe Take This With a Pinch of Salt:” The Overperformers
So, we’ve seen what can happen when a striker goes through a scoring drought. Keep up the underlying quality and quantity of your chances and the goals will come. Have faith.
The reverse is also true. Expected goals can give us more insight into whether a hot streak will continue to blaze bright or flicker into nothingness.
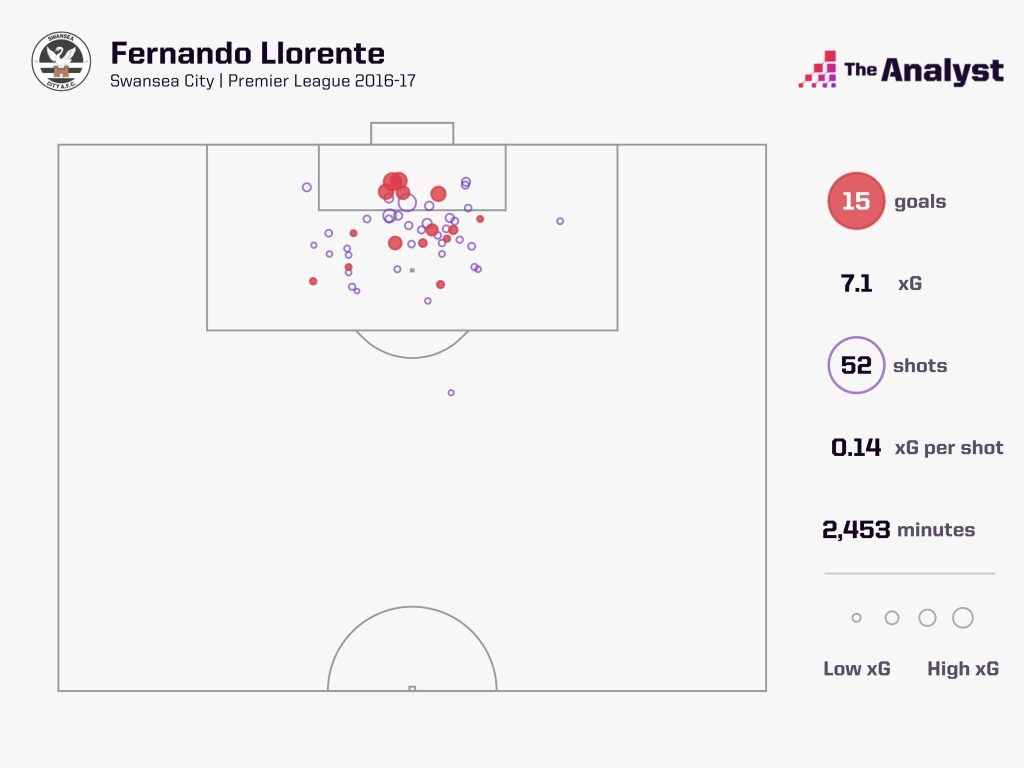
Fernando Llorente, Swansea City, 2016-17 | Goals (15), Expected Goals (7.1), Overperformance (+7.9)
What is it with Swansea City and Spanish one-season wonders? First it was everyone’s fantasy football darling Michu, who scored 18 goals in his debut season for the Swans, before doing not a lot else after that. In 2016-17 it was Fernando Llorente, who Swansea acquired from Sevilla. The Spaniard’s 15 goals that season helped keep Swansea in the division and piqued the interest of Tottenham who swooped in with a £12m bid the following summer to bring Llorente to north London. Maybe they were a little hasty…
Llorente’s 15 goals for Swansea in 2016-17 came from an expected goals total of just 7.1. He outshot his xG by almost eight goals, which is the sixth-highest overperformance in recorded Premier League history.
Llorente did make some crucial contributions to Spurs’ 2018-19 Champions League run, but two goals in 36 league appearances does not scream success. In fact, in the five full seasons after his one at Swansea, the forward has yet to score more than three times in the league. Llorente had a handsome record for Athletic Bilbao, yes, but Tottenham should have been smarter than to sign a 31-year-old striker off the back of an outlier season.
Timo Werner, RB Leipzig, 2019-20 | Goals (28), Expected Goals (21.3), Overperformance (+6.7)
2019-20 was the season that effectively got Timo Werner his big-money move to the Premier League. That season was the culmination of Werner’s time at Leipzig, and confirmation that he was ready to make the next step. He ran riot in front of goal, scoring 28 goals in the league, a further six in cup competitions and, for a brief spell between December and January, seemed to be the catalyst for finally breaking Bayern Munich’s stranglehold on the Bundesliga crown.
Leipzig would stumble to third after patchy form post-COVID break but Werner’s form in front of goal was rewarded with a big summer transfer move to Chelsea.
Now by no means are we saying this was a bad transfer at the time. Plenty of top European clubs were courting Werner, and the £47.5m that Chelsea got him for – via activating his release clause – felt like decent business.
But he did flash hot in his final year in Germany, his 28 league goals coming from 21.3 expected goals, for an overperformance of 6.7. Only Jadon Sancho – whose 17 goals came from 10.1 xG – outperformed his underlying numbers by more. And he has also struggled to adapt to the Premier League thus far.
It should be said that Werner’s overperformance in relative terms (31%) isn’t quite as bad as his absolute overperformance. And what’s probably more important about his final season at Leipzig is that he accumulated those xG numbers in the first place. In 2019-20, the numbers tell us that he got in positions for chances worth >21 goals, which was the fourth-highest total that year across Europe’s big five leagues. Nothing beats scoring of course, but the ability to get into those positions can sometimes be more important than how your actual performance compares against those numbers.
Despite that, Werner moved to Chelsea and in the 2020-21 season, nothing seemed to go his way. He scored just six goals in 35 Premier League appearances, enduring a 14-game goalless run between November 2020 and February 2021.
He was getting into good scoring positions though, and it felt like every other week he was scoring a disallowed offside goal. Things conspired to go against him. Despite scoring six times, he accumulated 11.5 xG, underperforming his total more than any other player that year.
Chelsea’s acquisition of Romelu Lukaku was about a clear a sign you could get that the club felt they needed more up top. This season, Werner’s involvements for the Blues have largely been from the bench, while he struggled with Covid-19 in December 2021.
It’s funny. Combine his final year at Leipzig with his first at Chelsea and his goals to expected goals ratio is almost 1:1. The law of averages can be a cruel mistress.
Paulo Dybala, Juventus, 2017-18 | Goals (22), Expected Goals (12.3), Overperformance (+9.7)
Paulo Dybala’s most prolific season in a Juventus shirt, and the only time he’s eclipsed 20+ league goals in a single campaign. A look at his goal map below shows that seven of those strikes came from outside the box, as he whipped in exquisite free-kicks and sumptuous long-range efforts. As a result of scoring plenty of goals from difficult scoring situations, he overperformed his xG total by almost 10. That’s the second-highest overperformance in recorded Serie A history.
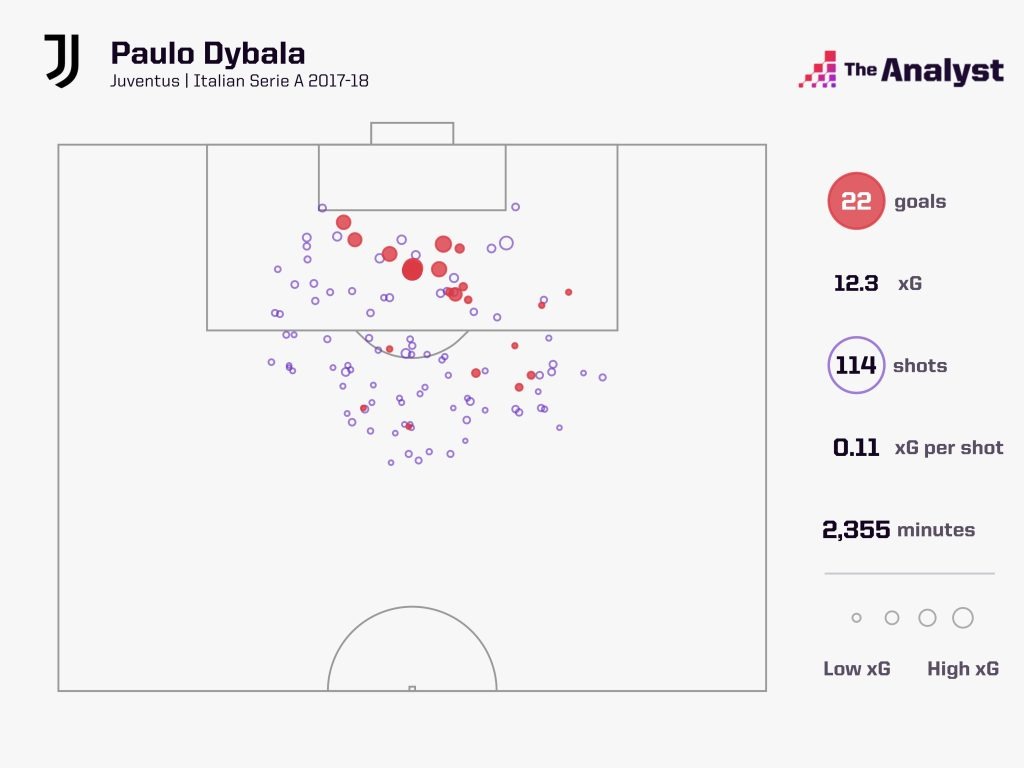
The size of those circles above shows us that, logically, shots from outside the area are a lot harder to score from than closer range attempts. And by definition, scoring them is less repeatable. Since 2017-18, Dybala has struggled to recapture his groove from range, despite maintaining similar shot volumes from outside the box (2.6 per 90 in 17-18 vs. 2.1 per 90 since). His seven goals from outside the box in 2017-18 is the same number he managed across his next four, and Dybala’s goal tallies haven’t got close to that 2018 peak.
It’s very hard, unless you’re Lionel Messi, to replicate that level of precision year over year.
A quick word on the PSG man. With just two goals this year from 5.7 xG, the Argentine is probably going through his first finishing slump in … forever?
One of only a few players proven to be able to ‘outrun’ expected goals, don’t be surprised to see Ballon d’or Winner, who started February with the same number of league goals as Josh Sargent, find his finishing boots soon.
Enjoy this? Subscribe to our mailing list to receive exclusive weekly content.