Football is a low-scoring sport. The statistically most common score line in a match is 1-0. While it is undoubtably goals that win you games, they don’t necessarily tell the full story of how a match was played out. We intuitively know that not every 1-0 is the same. But how can we tell this story?
For many years, the media has added extra context to the result of a match with box scores. These include a list of traditional metrics, such as possession and shots, and are typically seen in a game summary or in a match report. An example of this can be seen on a BBC match report below:
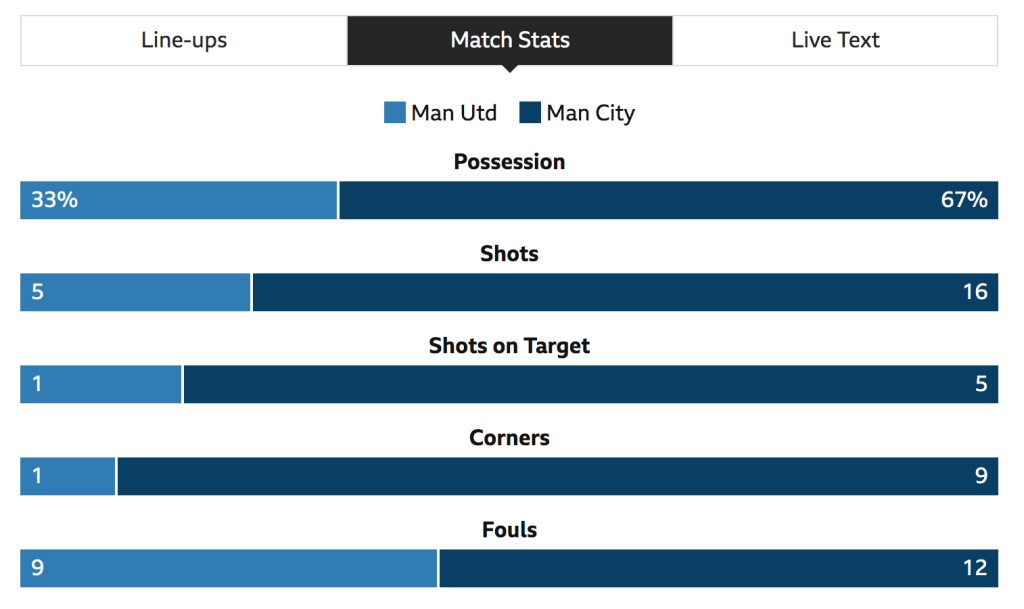
The introduction of advanced metrics like expected goals (xG) have enriched these box scores further. But most of these metrics only look at events in isolation. We need a more holistic view of a game.
Match momentum takes into account every on-ball action and allows us to see how dangerous each team was as the match unfolded, painting a more chronological story to the reader.
What is Match Momentum?
Match momentum measures the swing of the match and which team is creating more threatening situations at certain points in time. It does this by measuring the likelihood of the team in possession scoring within the next 10 seconds.
Match momentum is derived from another Stats Perform Qwinn model called possession value. Possession value measures the impact each individual event on the pitch has on changing the probability of team scoring within the next 10 seconds.
For example, carrying or passing the ball into dangerous areas around the opposition penalty box are valued much higher than passive possession around the halfway line. We can then aggregate these individual actions to the team level, allowing us to see which team had the more dangerous possessions.
How Do We Calculate It?
Each minute, match momentum compares the two most threatening situations each team had leading up to that minute, measured by possession value, to see which team was the most likely to score at that time.
To calculate this:
- We look at the maximum possession value for each team in every minute of the game so far (capped between zero and 0.1).
- The threat of each team is then a combination of these values, weighted for how recently they occurred, with the most recent minutes having more influence on the final value. Only the most recent three to four minutes have significant impact here.
- The momentum for a given minute then takes the difference between these values for each team to see who was more dominant.
The capping of the values and smoothing of the highest value actions over time avoids large fluctuations in momentum between each minute.
Let’s take the Manchester derby as an example. In the sixth minute of the game, shortly before the first goal of the game, Manchester United had a maximum possession value of 0.02 (adjusted for how dangerous they were in the time before this minute), while Manchester City had a higher value of 0.08.
By taking the difference between these peak values, we find that the match momentum in this minute (0.06) was in favour of Manchester City. This means that in the sixth minute of the match, City were 6% more likely (in absolute terms) to score within the next 10 seconds than Manchester United.
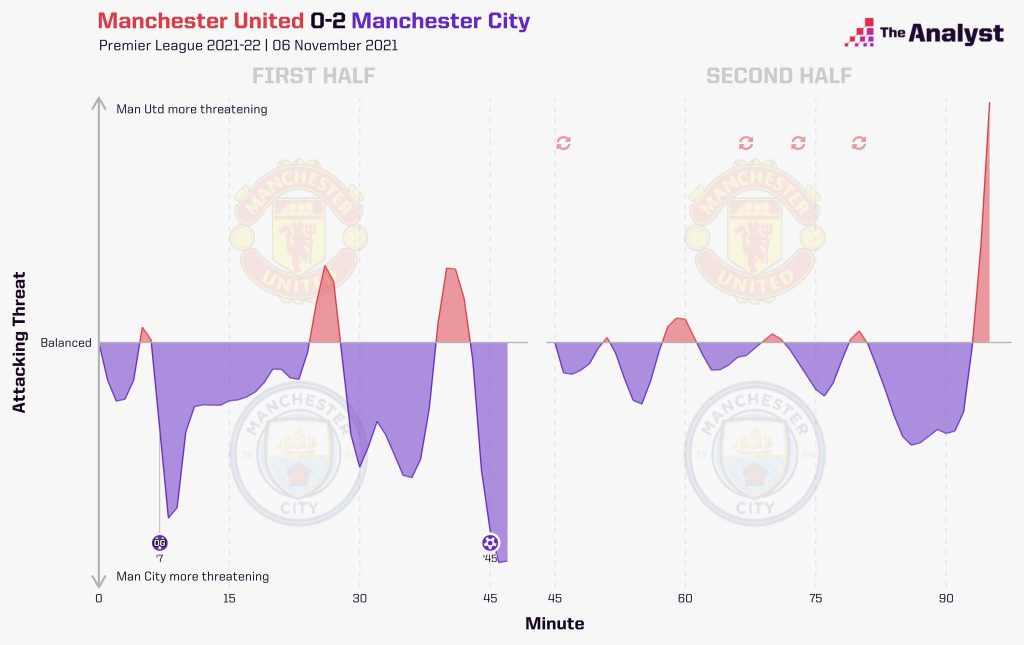
Both teams may have enjoyed situations where they were likely to score, but the match momentum tells us that Manchester City were the more dominant of the two teams at that time.
Match Momentum in Action
The aim of match momentum is to quantify which team is more likely to score at a certain moment. Other advanced metrics like expected goals can measure this but are only captured when a team takes a shot.
Momentum, through the possession value model, takes into account every action so we can still measure a team’s threat if they get into dangerous areas but don’t convert this into a shot.
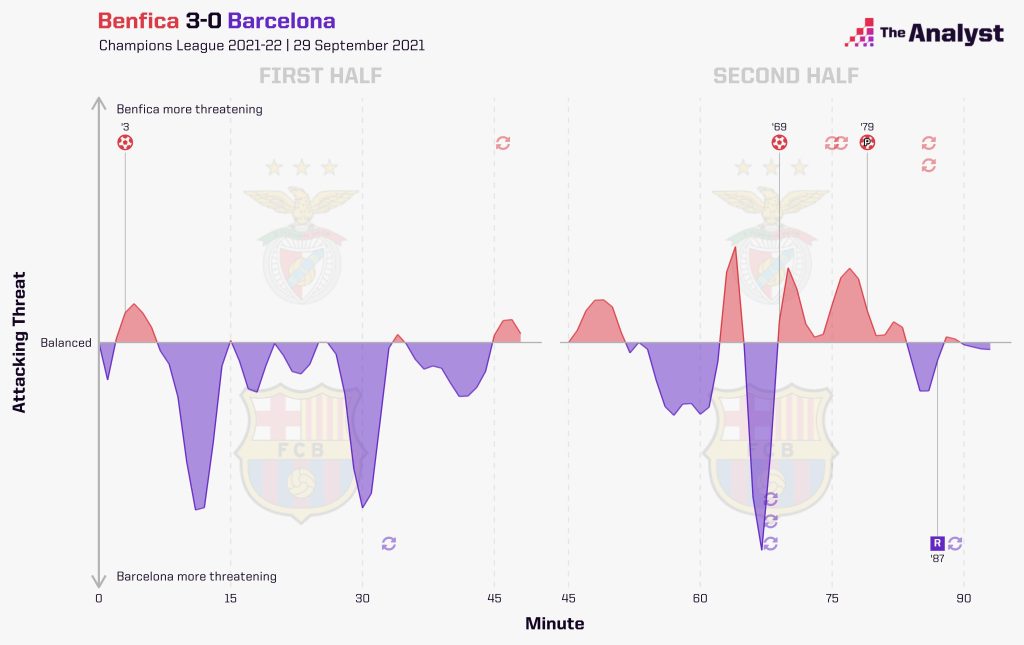
In their 3-0 loss to Benfica in the Champions League this season, Barcelona only attempted one shot in the second half despite enjoying plenty of attacking threat. We can now visualise this to see how dominant Barcelona were, despite the final result.
Another benefit of match momentum is that we can often see the context in which a goal was scored. For example, let’s look at Arsenal and Crystal Palace’s 2-2 draw in the Premier League earlier this season.
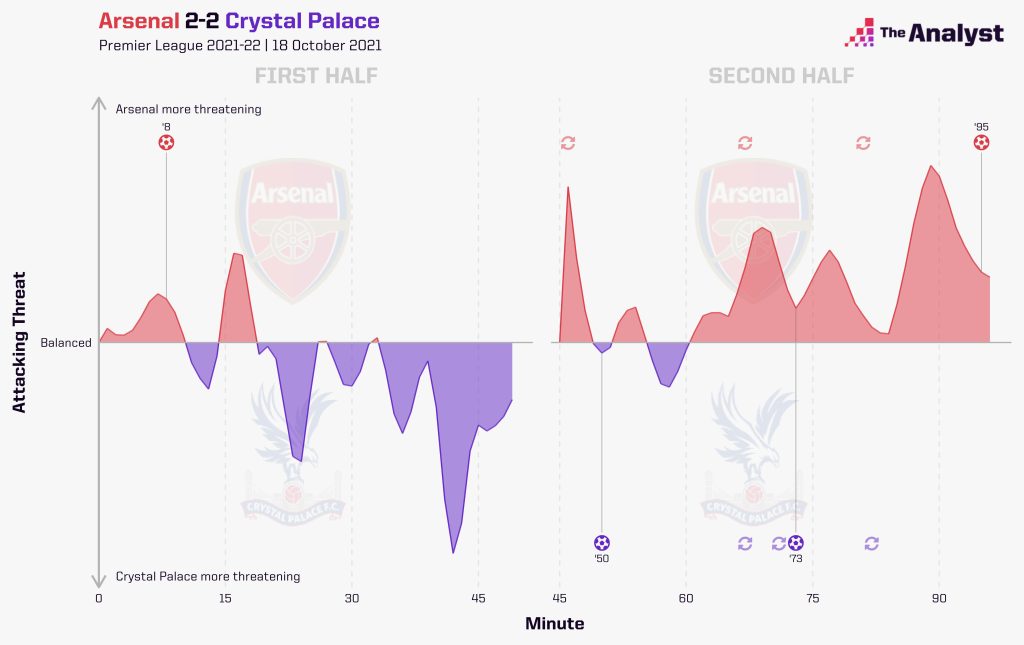
While the story of the game and switch in dominance between the two teams is evident, the most interesting insight was the second Palace goal in the 73rd minute when Odsonne Édouard was able to finish off a Crystal Palace counterattack.
Using momentum, we can now see that Arsenal were the far more likely team to score at this time and that Patrick Viera’s Palace grabbed this goal against the run of play at the time.
Match Momentum with Broadcasters
Match momentum has already been utilised by broadcasters. French broadcaster, Canal+, used the metric as part of their Champions League coverage to enhance their ability to tell the story of the game.
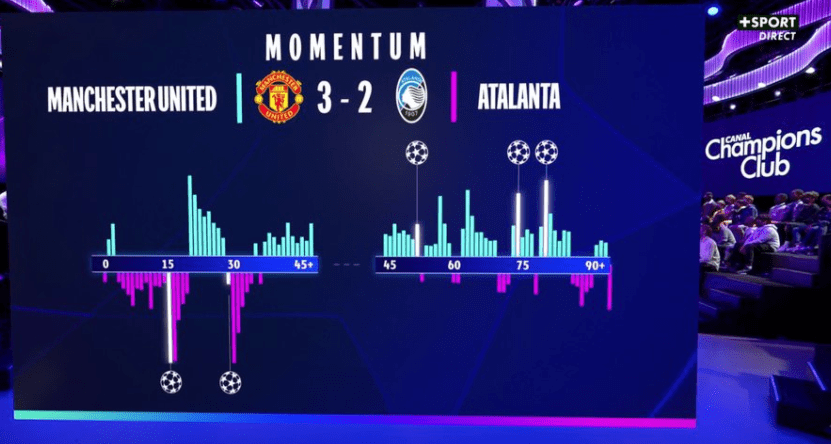
You can clearly see how Atalanta capitalised on two early periods of dominance by scoring two goals. For the remainder of the match, Manchester United were chasing the game and this was reflected in how dangerous they were.
Meanwhile, Premier League Productions framed this metric in a slightly different way. They displayed the proportion of the momentum, or goal threat, during their Premier League coverage to show how Leicester City had been far more likely to score than Burnley over the last 10 minutes.
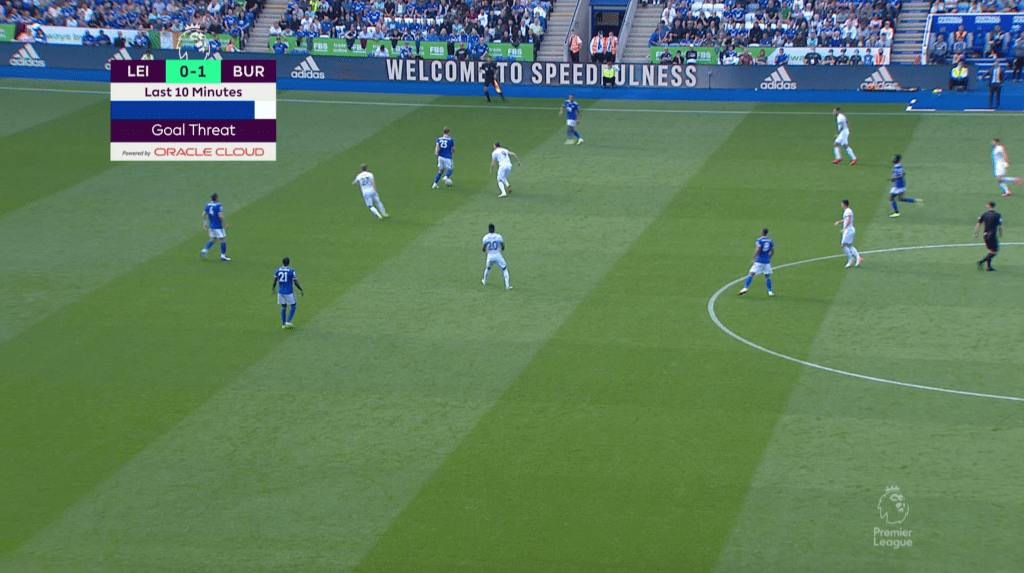
Their timing was perfect. 12 seconds later, Leicester City’s Jamie Vardy capitalised on this momentum and had the ball in the back of the net.
Match momentum is another tool to add to our statistical arsenal. In a football match, teams enjoy different periods of dominance and match momentum now gives us a way to show that.
Enjoy this? Subscribe to our mailing list to receive exclusive weekly content.