If you listen to enough MLB broadcasts, there’s a phrase you can hear several times in the weeks leading up to the playoffs.
One team with a couple of dominant pitchers will lead the opposing announcers to state the common knowledge that: “This isn’t a team you want to face in October” or “These guys are set up nicely for a long October run.”
Yet, those same remarks aren’t made as often about an offense featuring several talented players. Does a dominant pitching rotation really lead to more championships? Are there other aspects of a team’s regular-season performance that are more indicative of who will wear the crown when the dust settles?
The easiest way to determine what wins in October is to look at the stats of the teams that have won it all before, but this comes with challenges about sample size. Pick a sample too small, and the data from the winning teams is almost meaningless. Pick a sample too large, and the data has teams from a game that is dramatically different from the game today.
We settled on looking at every team that has won the championship since 2010. It’s not a large enough sample to make grand assumptions, but it can be useful to see what all or most of them have in common.
Hit and Win
It may be surprising, but position player strength has had a stronger correlation to winning the championship than either rotation or bullpen strength over the last decade.
Seven of the 11 champions since 2010 have had a top-five on-base percentage in the league the year they won it all. Nine of the teams had a top-half OBP, with only two of the San Francisco Giants three World Series teams in that time frame (2010 and 2014) finishing in the bottom half of the league. All 11 title teams in that time frame finished with a slugging percentage in the top 13 in the league.
Every team did finish in the top 14 in ERA the year they won the title as well, but only four of those teams were in the top five in that category. And, when looking at the Baseball Reference WAR of each positional grouping, which obviously factors in a defensive component as well, the numbers favor the position players even more.
All 11 title winners had a group of position players that finished in the top 13 in the league in bWAR, with the 2010 Giants the lowest finisher of the group. Nine of the 11 teams had a top-five group of position players by bWAR. And with the exception of two of the Giants teams (and technically the Los Angeles Dodgers of last year due to a shorter season), all of these champions had at least 25 bWAR from their position players.
When it comes to starters and relievers, the correlation hasn’t been as strong. Seven of the 11 teams were in the top 15 in the league in starting pitcher bWAR, and six were in the top 15 in reliever bWAR. In fact, both the 2012 Giants and 2019 Washington Nationals took home the crown despite finishing in the bottom five in the league in reliever bWAR.
That’s not to say a dominant bullpen can’t lead you to a title. The 2015 Kansas City Royals leaned on a shutdown bullpen to cover for an average starting staff. But it’s easier to hide a poor starting staff by leaning on a dominant bullpen or make up for a subpar bullpen by upping the innings a strong starting staff pitches (Madison Bumgarner nods his head). It’s hard to hide a lineup without enough good hitters.
Stars Need to Shine
It’s not exactly groundbreaking news to say that the team that has a lot of players performing at an elite level will have an advantage over the team that doesn’t.
But sometimes, star power can be trivialized in the discourse due to the nature of baseball as a team game. It isn’t the same as basketball and football in that one star cannot drag a team to (and sometimes through) the playoffs. If that were the case, Mike Trout would probably be sitting at home with a lot of playoff hardware instead of having a mere three games in 2014 as the extent of his playoff resume.
But as much as we remember all the great triumphs of little-known players for their October exploits over the years, it often comes down to players who are at or near the top of the league performing the way they need to for teams to win. (Especially recently, as the league has grown more polarized and the teams at the top keep getting better and better.)
Since the 2016 Chicago Cubs, every team has had at least four pitchers in top 100 for pitcher bWAR the year they won the title. While four may not seem like a lot, keep in mind that starting rotations are only five deep, so each of these teams had a combination of at least four very good starters and electric relievers (since only the best relievers in baseball can beat out starters in WAR).
And in that same time frame, only the 2018 Boston Red Sox have had less than five players in the top 100 in position player bWAR (four), and they compensated by having four of the top 49 position players in the league by this metric, including the top player in Mookie Betts.
While we remember the likes of Steve Pearce for his surprising World Series MVP win, we remember him because he’s the exception to the normal occurrence of a star or near-star winning that award. Pearce is the only player that has won a World Series MVP since 2010 that hasn’t made an All-Star team, and David Freese is the only other one who hasn’t made multiple All-Star teams.
Teams need all 25 guys on the roster to win a World Series, but they especially need a deep group of elite talent at the top of the roster as well.
Who Fits the Bill This Year?
So which teams meet the thresholds laid out by the champions since 2010?
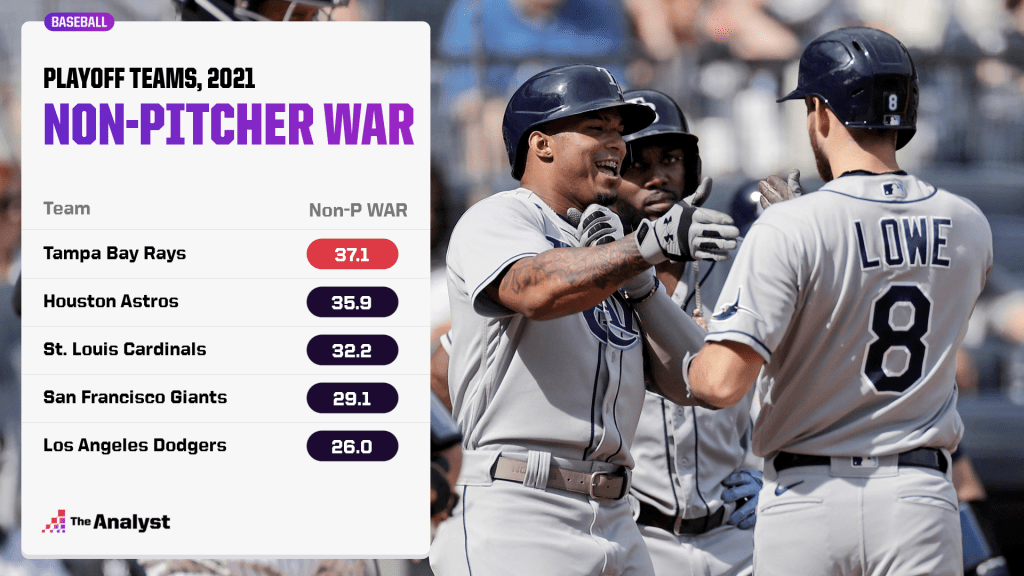
Well, only five teams which made the playoffs have groups of position players with 25 or greater bWAR, so the other teams will have to hope to join the 2010 and 2012 Giants as champions that haven’t hit that mark recently.
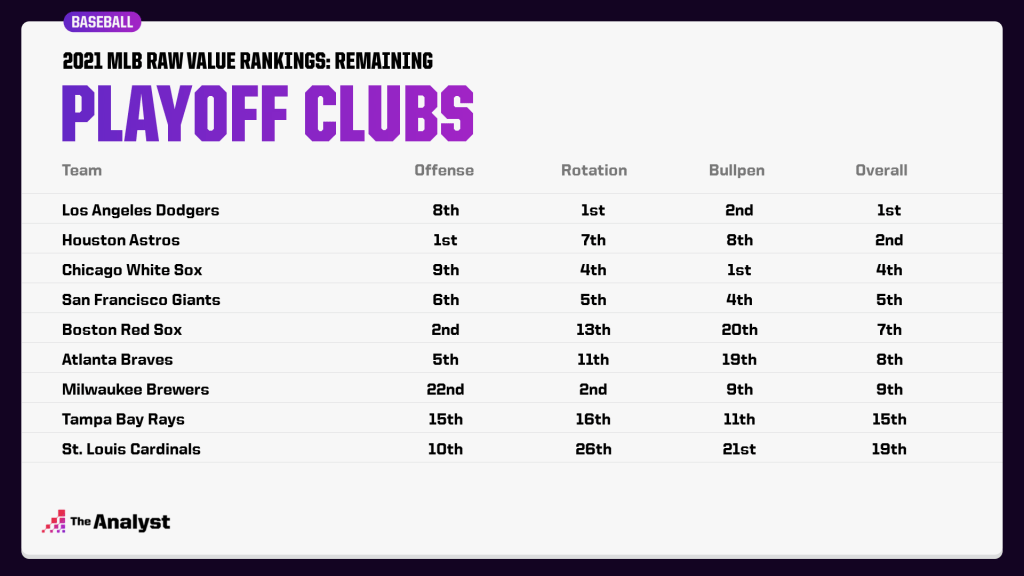
Only the New York Yankees, Giants, and Milwaukee Brewers failed to get five players in the top 100 of position player bWAR this year. And the Yankees have already been eliminated in the wild-card round. The Red Sox, Tampa Bay Rays and St. Louis Cardinals all had fewer than four pitchers in the top 100 for bWAR. In fact, Boston only ranked 13th in the majors in our raw value rotation rankings, while Tampa was 16th and St. Louis only ended up 26th.
Does this mean that the teams that didn’t meet any of these thresholds should save us the time and go home now? Of course not. The Rays could utilize their deep group of talented players that Kevin Cash has at his disposal and finish what they started in 2020.
The Brewers could ride a dominant rotation (second in the majors in our raw value rankings) with an elite closer and a manager in Craig Counsel who knows how to use his pitching staff in creative ways. The Giants are a 107-win juggernaut that likely would have reached the position player threshold had it not been for injuries and players playing fewer games.
But all these teams would be bucking the trends of the past decade of champions. And we should at least acknowledge that October is more about which teams have the best rotation or the hot bullpen.
If we don’t learn from history, we’re doomed to repeat it – or at least repeat the same adages over the airwaves every October.
Enjoy this? Subscribe to our newsletter to receive our selection of the best content of the week. It’s free.
Design by Briggs Clinard.