One of the tools at the forefront of The Analyst’s Major League Baseball coverage is TVL data.
What is TVL data? It’s the end result of a process in which the pitch type, velocity and location of every pitch is tracked and collected so we can better explore both pitchers’ efficiency and hitters’ approach at the plate.
Analysis has gradually drifted from basic, easily calculated numbers like ERA, batting average, home runs and RBIs. And despite MLB teams’ foray into deep data for performance improvement and conditioning strategy, this evolution has been largely influenced by fans and media.
Baseball fans crave the behind-the-score story, wanting to know the how and why that support those basic statistics. Members of the media are not only looking to enrich their content, but they also vote for player awards. The outcomes of these awards are almost entirely determined by unique differentiators that are only detectable through advanced analytics.
In that sense, every single pitch thrown either tells its own story or contributes to a greater narrative. TVL data not only provides in-depth and unique pitch-by-pitch analysis, but it also supports predictive element that allows media, fans and teams to look into the future of a player’s career.
For example, when we broke down Boston Red Sox left-hander Chris Sale’s performance down the stretch of the 2021 season, the TVL data revealed that Sale had thrown a good mix of four-seam fastballs (47.7%), sliders (30.1%) and changeups (20.9%) during a strong seven-start stretch earlier in the year.
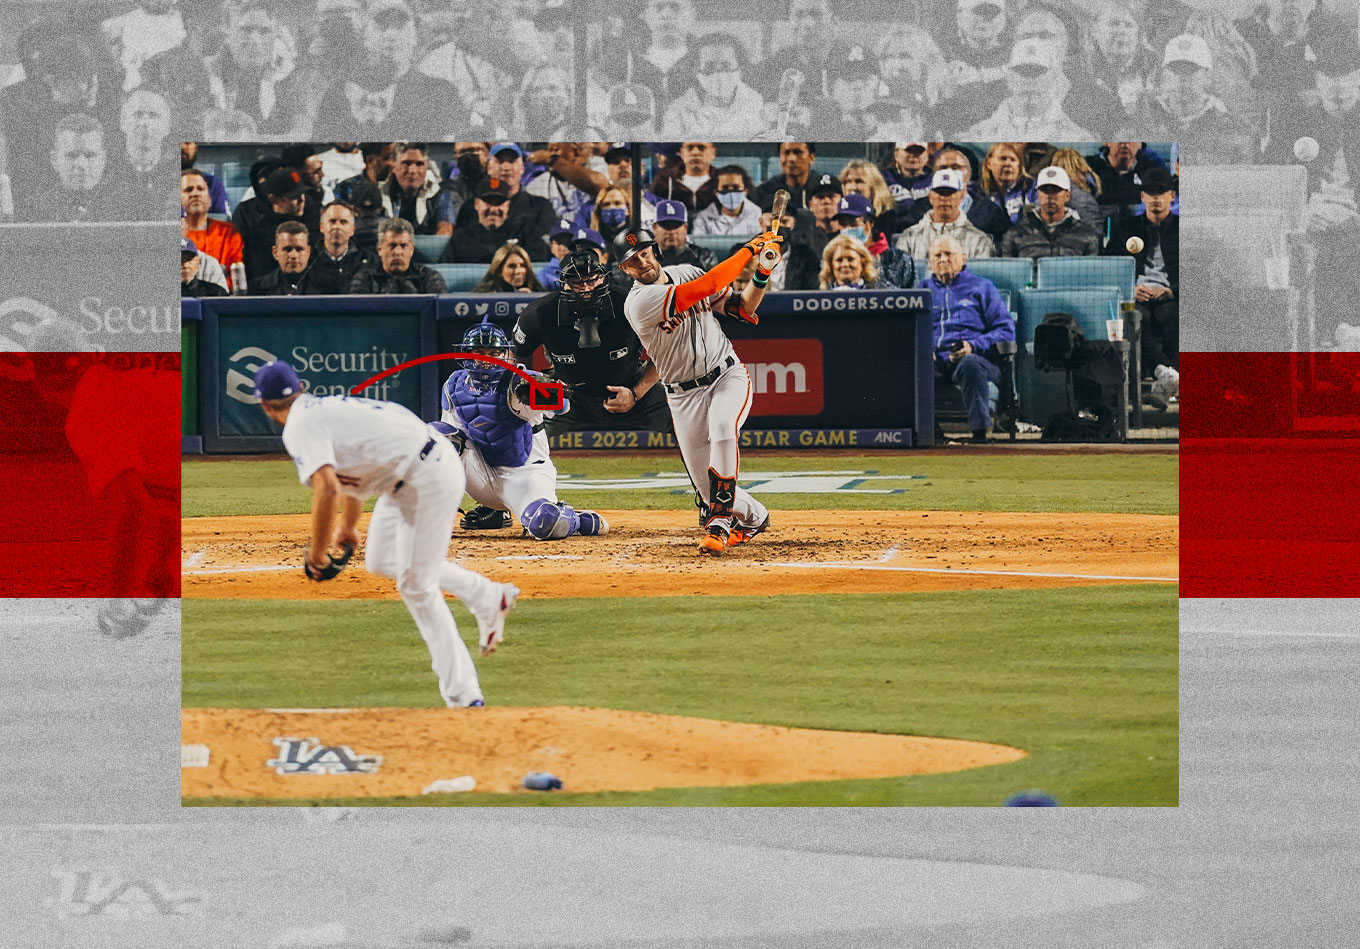
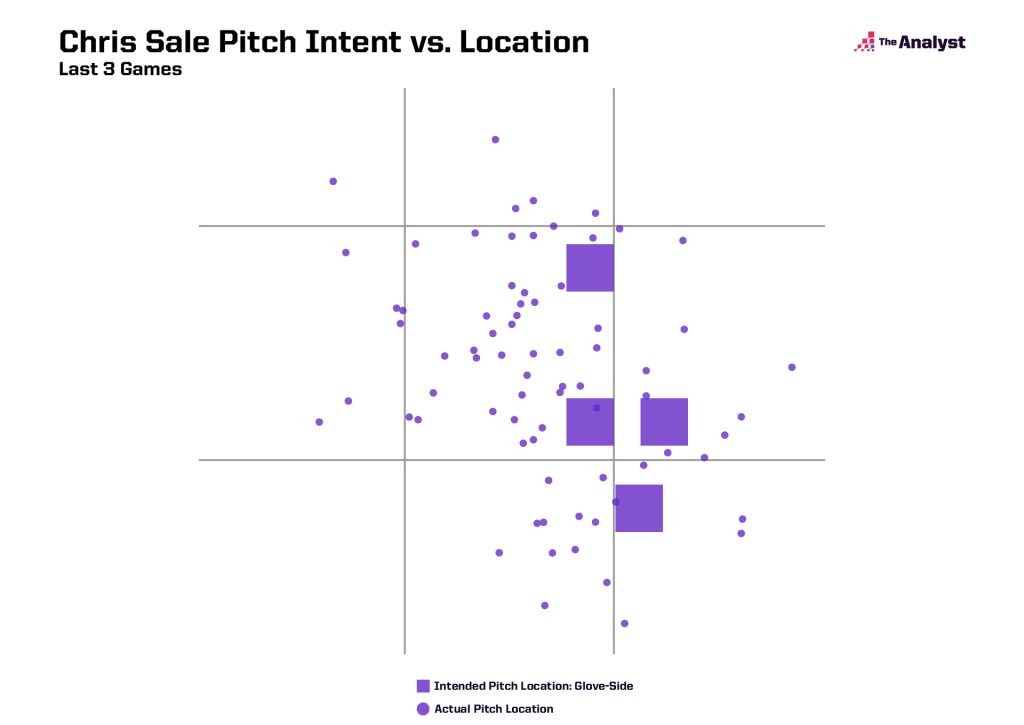
But while struggling in his three previous outings, Sale had relied heavily on his slider (40.1%), while nearly dropping the changeup altogether (13.0%). But the real problem was that Sale wasn’t exactly hitting the intended target when he tried to glove-side or inside to a right-handed batter (see below).
That trend continued in his next start when Sale gave up five hits and only last 2.2 innings in a 5-4 loss to the Houston Astros in Game 1 of the 2021 American League Championship Series.
From the mound, TVL data can also reveal what pitchers throw the most and how effective those pitches are. It can tell us the average speed, max velocity and spin rate of those pitches, and what the pitcher intends (think target) to do with them on a given count (see below).
Anthony DeSclafani Four-Seam Fastball Intent Ahead of the Count
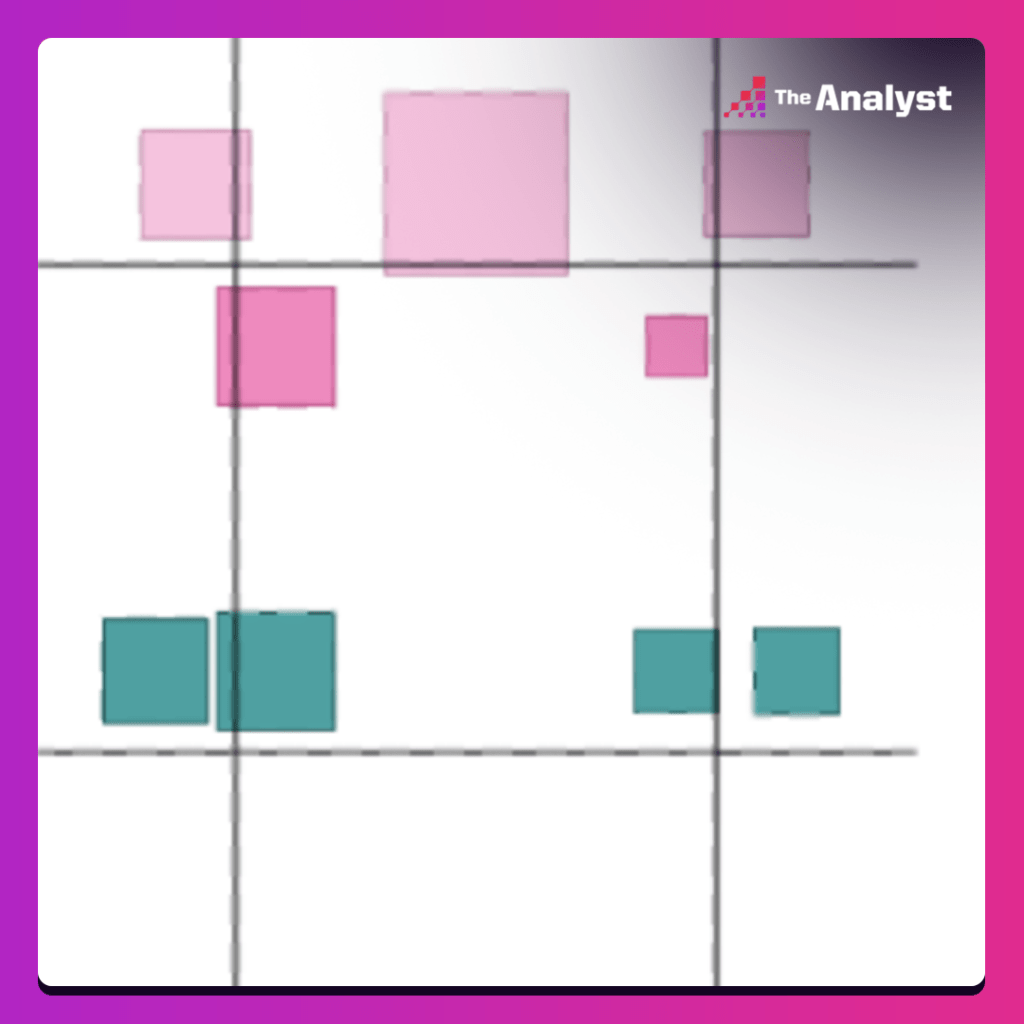
What if we want to know the swing-and-miss rate on each pitch? How many of each pitch intended to be strikes but ended up outside the zone? Or how about a pitcher’s repertoire and usage versus left-handed batters (see below). That’s all in the database as well.
Jose Urquidy Pitch Usage Against Left-Handed Batters
| Pitch Type | Usage Ahead in Count | Usage Behind in Count | Usage Even in Count | Total Usage |
|---|---|---|---|---|
| Four-Seam Fastball | 46.6% | 60.6% | 54.1% | 53.0% |
| Curveball | 13.2% | 8.1% | 26.0% | 15.9% |
| Slider | 3.8% | 2.5% | 1.6% | 2.8% |
| Changeup | 36.5% | 28.8% | 18.3% | 28.2% |
From the plate, TVL data can show which players sit on fastballs and crush them, which ones struggle when facing a splitter or the areas that are hot and cold zones for a given hitter.
It’s all there – and much more.
Graphic design by Matt Sisneros.