
Much was expected of the Cardinals at the start of the season. So were they underperforming over the first five months or are they playing over their heads at the right time? Can both be true? We’ve dug into our database and used an expected win-loss model to answer these questions and more.
Sometimes the best moves are the ones you don’t make.
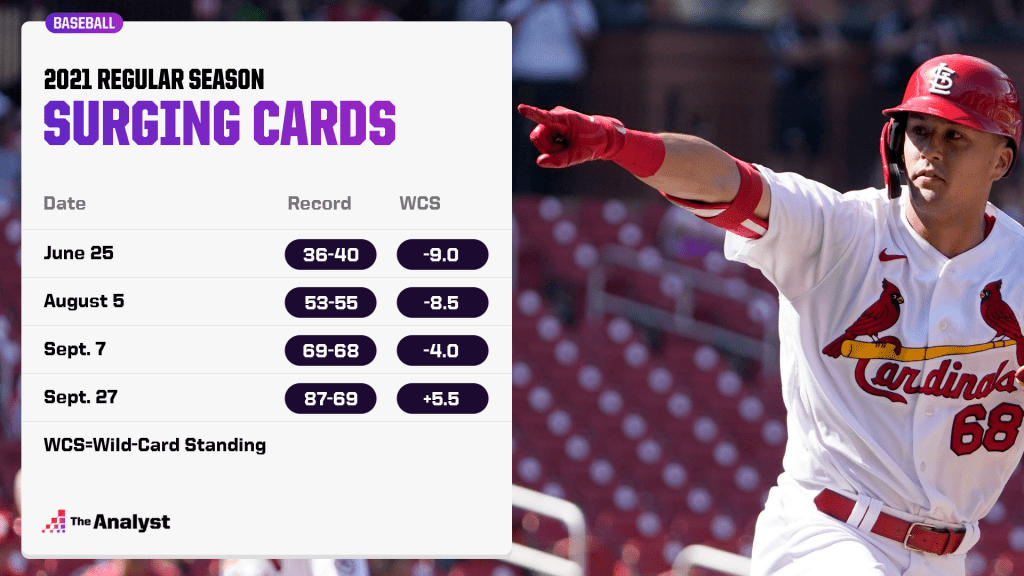
After losing their fifth straight game on June 25, the St. Louis Cardinals had fallen to a disappointing 36-40 and the difficult questions were already being asked.
It wasn’t an acceptable position to be in. Especially in St. Louis. Especially after the club had made a blockbuster trade to acquire perennial All-Star third baseman Nolan Arenado from the Colorado Rockies in the offseason.
They were seven games out of first place and nine back of a wild-card spot in late June. As a result, some of the headlines read: “The team’s coaching staff has come under fire” and “The Cardinals are a mess. Should someone be held accountable?” and “Should the Cardinals fire manager Mike Shildt?”
Things weren’t much better after three months had passed. On Sept. 7, St. Louis lost its fourth in a row to fall to 69-68, leaving the club with no hope of catching the Milwaukee Brewers atop the Central. And even though the San Diego Padres were well into a colossal collapse, the Cards’ four-game deficit in the wild-card race seemed massive under the circumstances.
Some of the same questions resurfaced in the headlines: “What would it take to fire Shildt?” and “When will the Cardinals change managers?” and “When did Shildt become a Mike Matheny clone?”
But the first step toward changing that narrative occurred when Tyler O’Neill and Yadier Molina homered, and Adam Wainwright pitched into the ninth inning of a 5-4 home win over the Los Angeles Dodgers on Sept. 8.
It started a stretch in which the Redbirds have won 18 of their last 19 – including a franchise-record 16 in a row – to turn their season around. In seemingly the blink of an eye, they’ve built a 5.5-game hold on the NL’s second wild-card spot and are on their way to the postseason for the third year in a row under Shildt, the 2019 NL Manager of the Year.
Some of the headlines now? “Shildt fuels turnaround in NL Central standings” and “Three reasons why St. Louis could be a threat in October” and “Cardinals extend winning streak, set MLB record.” They did that by ending the regular season with 11 straight road victories.
So what’s happened? Were the Cards simply underperforming for five months or are they playing way over their heads at the right time? Can both be true? We’ve dug into our database and used an expected win-loss model to answer these questions and more.
First, let’s point out that the team has had its share of injuries. Harrison Bader, Kwang Hyun Kim, O’Neill, Molina, Carlos Martinez and Paul DeJong were among the key players who served stints on the injured list before the calendar turned to June. But perhaps none bigger than the loss of ace Jack Flaherty (9-2, 3.30 ERA), who has only made four appearances since May and started a game for the first time in a month last Friday.
On Sept. 1, the Cardinals sat ninth in the National League and 16th in the majors in those rankings with a raw value (RV) of 99.6 – below the MLB average. Our adjusted team rankings are derived from a model that combines each player’s RV data and calculates a total for each club with respect to the league average being 100. RV+ examines how a hitter performs throughout each pitch of an at-bat rather than just the result, while RV- does the same for a pitcher.
After putting together one of the best stretches in franchise history, the Redbirds had to have made an impressive leap in the adjusted team rankings, right?
Wrong.
Stunningly, St. Louis has actually dropped slightly in both its adjusted team ranking (18th overall) and RV (98.8) since the beginning of the month. It could be considered great managerial work how “Shildt fueled” this turnaround that has the Cardinals entering Friday’s action with an 87-69 record.
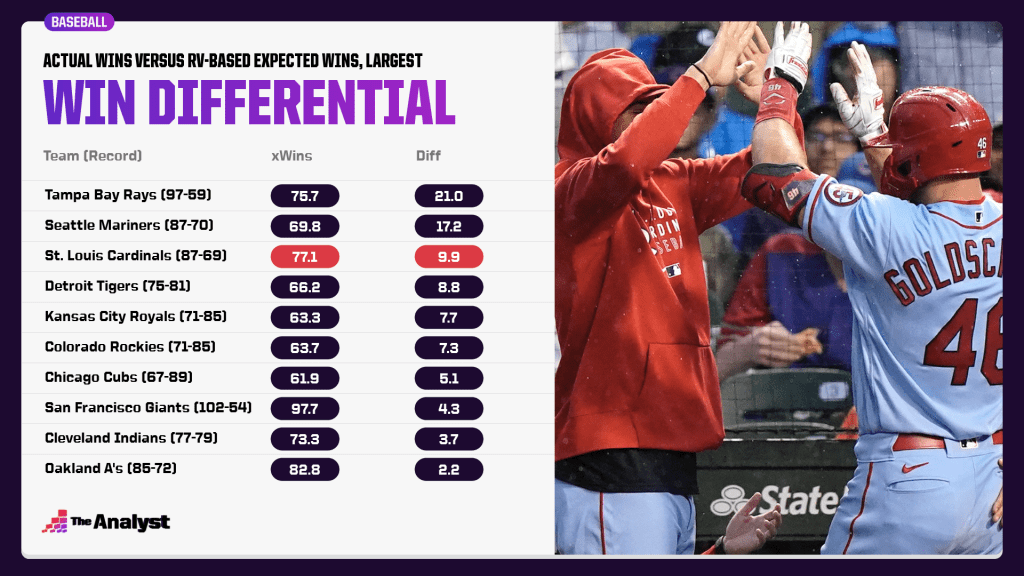
That’s nearly a full 10 games better than their RV-based expected win-loss record (77.1-78.9). How did we figure this? By estimating how many runs each team would score and allow based on their RV and converting that into a winning percentage.
But as we dig a little deeper and we find that there’s more going on than just a manager finding his way late in the season. Is he pulling all the right strings? Maybe, but that doesn’t mean that there isn’t quite a bit of luck at work here. There are two key areas of above-the-norm performance that have helped the Cards ‘steal’ 10 extra wins from their expected record.
The bullpen: On Sept. 1, St. Louis relievers ranked 20th in the majors with an RV- of 97.9. They were also 16th in MLB with a 4.16 ERA and dead last with just 1.83 strikeouts per walk. Since then, the Redbirds rank 11th in the majors with an RV- of 93.3, fourth with a 2.97 ERA and fifth with 2.90 strikeouts per walk.
Kodi Whitley has stepped up, throwing 13.0 scoreless innings in 11 appearances since re-joining the pen in late August. But one of the biggest moves Shildt did make was turning the closer duties over to Giovanny Gallegos on Aug. 30. The veteran right-hander has since converted 12 of his 13 save opportunities while only giving up one run in those chances.
“Clutch” hitting: On Sept. 7, the Cardinals ranked right in the middle of the pack at 15th in the majors with a .253 batting average with runners in scoring position and only 24th with a .284 batting average on balls in play (BABIP). Since the start of their 16-game run, the Cards lead all of baseball with a .344 average with runners in scoring position and rank sixth with a .317 BABIP.
Edmundo Sosa has gone 6 for 12 with two doubles with runners in scoring position over this stretch, while Yadier Molina is 7 for 15 with a home run and nine RBIs and Paul Goldschmidt has gone 8 for 18 with two homers and nine RBIs. Bader is 6 for 14 with eight RBIs and Dylan Carlson has gone 5 for 12 with a homer, two doubles and 10 RBIs. You get the picture.
While it’s conceivable that the Cardinals bullpen with Gallegos in the back could continue to pitch well, it’s not nearly as easy to make the same assumption about the team’s offense. Considering the league average is .291 for BABIP and .251 for batting average with runners in scoring position this season, it’s more than likely that St. Louis will experience a regression is this area sooner rather than later.
With the postseason set to begin Oct. 5, the only question is how soon. Until then, everyone in St. Louis will no doubt enjoy the ride.
Data modeling by Lucas Haupt. Design by Briggs Clinard.