
Depending on your taste, the juiciest game on the calendar this weekend is likely either the Cascadia Derby between the Portland Timbers and the Seattle Sounders or the Eastern Conference meeting between Nashville and D.C. United. One checks the rivalry box while the other is for the tacticians.
We’ll start in the West, but if you’re here for the truly nerdy numbers, skip on down to Nashville-D.C.
Portland vs. Seattle
According to the standings, this game is an easy call. Seattle are 10 points clear of the Timbers, have a significantly better goal differential (+18 to be exact), and have the fewest away losses in MLS (just the one). However, several important metrics convey this game may be closer than might appear. Also, it’s a derby match! Form, as it is often said, should be thrown out the window. We’ll see, of course.
The reality is there are some significant stylistic differences that will dictate how this game will be played. Seattle will play with a back three, concede possession, and strike when the ball moves backwards or when there’s a bad Timbers’ touch. They do have the best tackle success rate in the league at 65%. However, it does sometimes mean they can be outpossessed for long periods of time.
In fact, Portland must have more of the ball than Seattle. All things being equal, one dam is far more likely to break, and it will be the Sounders marching through it. If Portland can manage to pin the Sounder’s wingbacks in their own half, possibly leaving wingers high and wide or inside out runs from a center-forward, then there’s a chance the Timbers can control this game. But that involves bodies in the attacking half, risking even more easy chances from a quick Seattle counter.
Now for the statistical similarities in their attacks. If we sort the league by expected goals, both teams are in the top third of the league, and Seattle sit only just above Portland with 27.6 and 26.5. Seattle have played one extra game, so per match, Portland have averaged 1.42 xG compared to Seattle’s 1.4. They cross the ball a similar amount (about 18 per game) with the same kind of accuracy (~26%). The number of touches in the box per game (~20) and shot attempts per game (~13) are remarkably close.
While many important offensive metrics seem to put this game at a stalemate, the defensive statistics are what really separate the two opponents. To start simply, at 14, the Sounders have conceded the fewest goals in the league. They’re outperforming their 19.5 expected goals against tally, but if we look at the xG on target conceded, they’re the third best in the league with 15.6.
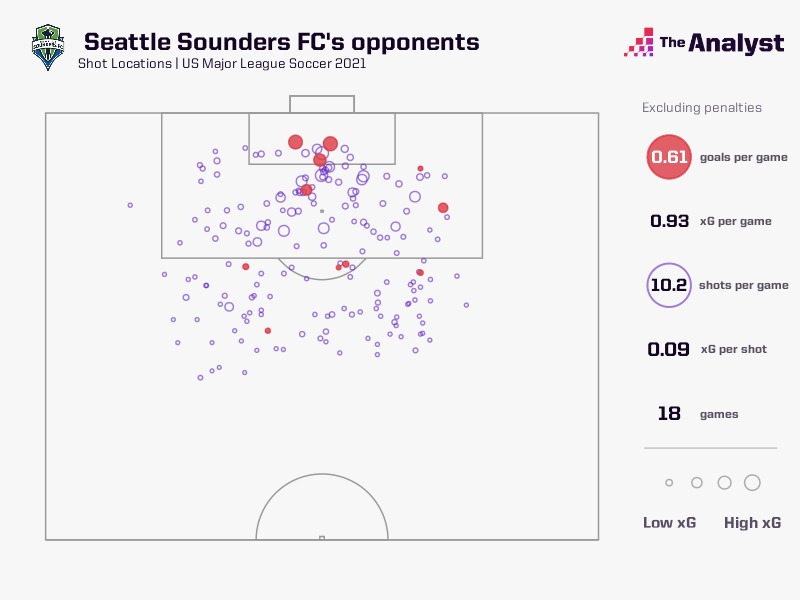
What’s more impressive is how the Sounders protect their own penalty area. Seattle have conceded just six non-penalty goals within their own box (plus three penalties). That’s the fewest in the league by far.
Compared to Seattle, Portland’s defensive numbers look a bit ugly. The Timbers have conceded 29 goals – the most in the Western Conference – all from inside the box, and their 33.4 xG against is the worst in the league.
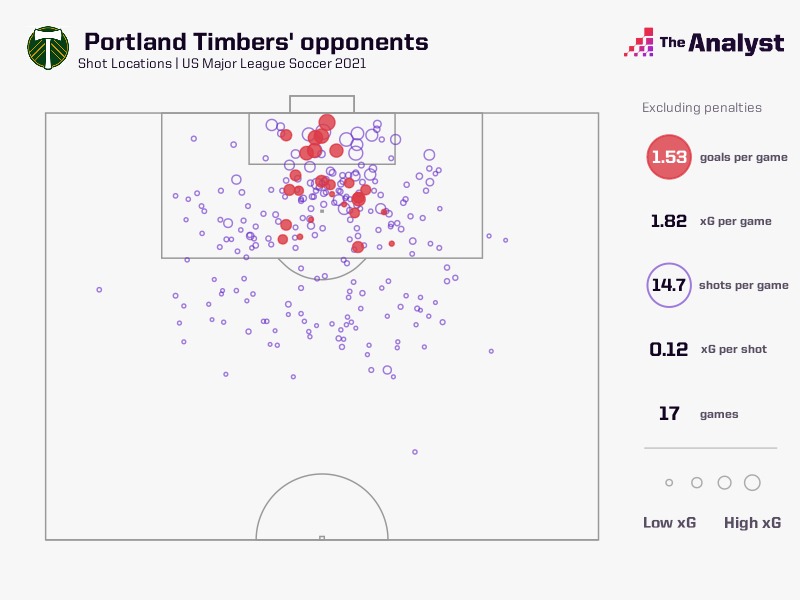
That’s a lot of red right down the heart of the box. Part of the problem might be their 37 direct attacks against which is second-most in the league. Typically, these are a result of a defense that is not set which can lead to easy goals.
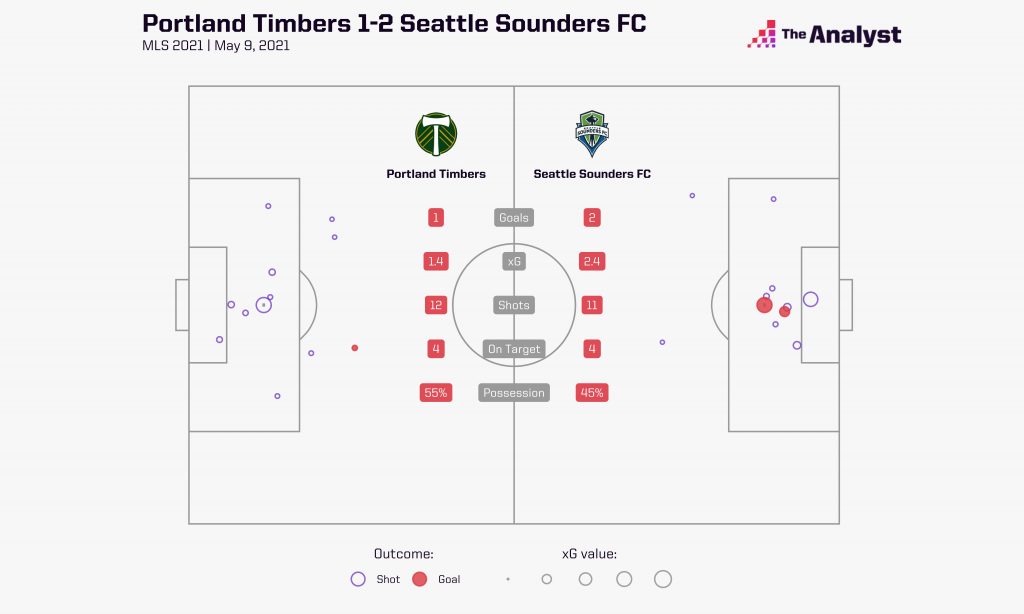
That was apparent the last time they met back on May 9. Portland had more of the ball, Seattle created better chances, but the difference was a made penalty vs. a missed penalty:
Nashville vs. D.C. United
Two teams that sit next to each other in the Eastern Conference standings and are currently above the playoff line meet this upcoming weekend. Nashville is one point ahead of D.C. United, but United has found some really nice form and is climbing the table quickly. While both play different versions of a three-back, that’s pretty much where the similarities end. Let’s start by looking at the teams’ contrasting styles.
Nashville of late have played in a 3-5-2, using dual pivot midfielders to come take the ball off of the center backs, letting the wing backs get up the field, and leaving two players centrally up top. They spend a normal amount of time keeping the ball. Their 174 10+ pass sequences, 3.45 passes per sequence, 9.3 seconds per sequence and direct speed of 1.58 meters per second progressed up the pitch during their sequences are all right around the league average. Defensively, they’re one of the most passive teams. The 227 10+ pass sequences and 6,527 passes against are the highest totals in the league. They also concede 13.4 passes per defensive action, resulting in a below league-average starting distance of 40.6 for their own sequences.
Both behaviors fit nicely into one type of story, until we look at their direct attacking numbers. Their 37 direct attacks is the very top of the league (from which they’ve scored three goals), and their total fast breaks of 12 are above the league average of 8.81. It’s a classic rope-a-dope. Nashville allow slow, heavy passing build ups, pull opponents into traps and spring forward when the time is right. Similarly, they keep the ball until opposing midfields have been drawn forward, then they’ll launch an attack over the top.
D.C. United play a chaotic 3-4-3, with a single target forward and inverted wingers, allowing wingbacks to overlap as they please. They rarely use the central midfielders in possession, preferring to go around or over the midfield instead. Their 1,165 long passes rank second in the league. In fact, 17% of their attempted passes have been long passes, the highest rate in the league. D.C. don’t really care to keep the ball for long periods of time, which is supported by their average sequence duration of 7.36 seconds being forth lowest in the league. Instead, they focus on being incredibly active defensively. Their 249 interceptions are tied for second in the league, and their duel (1,997) and tackle (340) attempts are both in the top quarter. They’ve tallied 616 defensive actions, third in the league, behind only well-established pressers New York Red Bulls and LAFC.
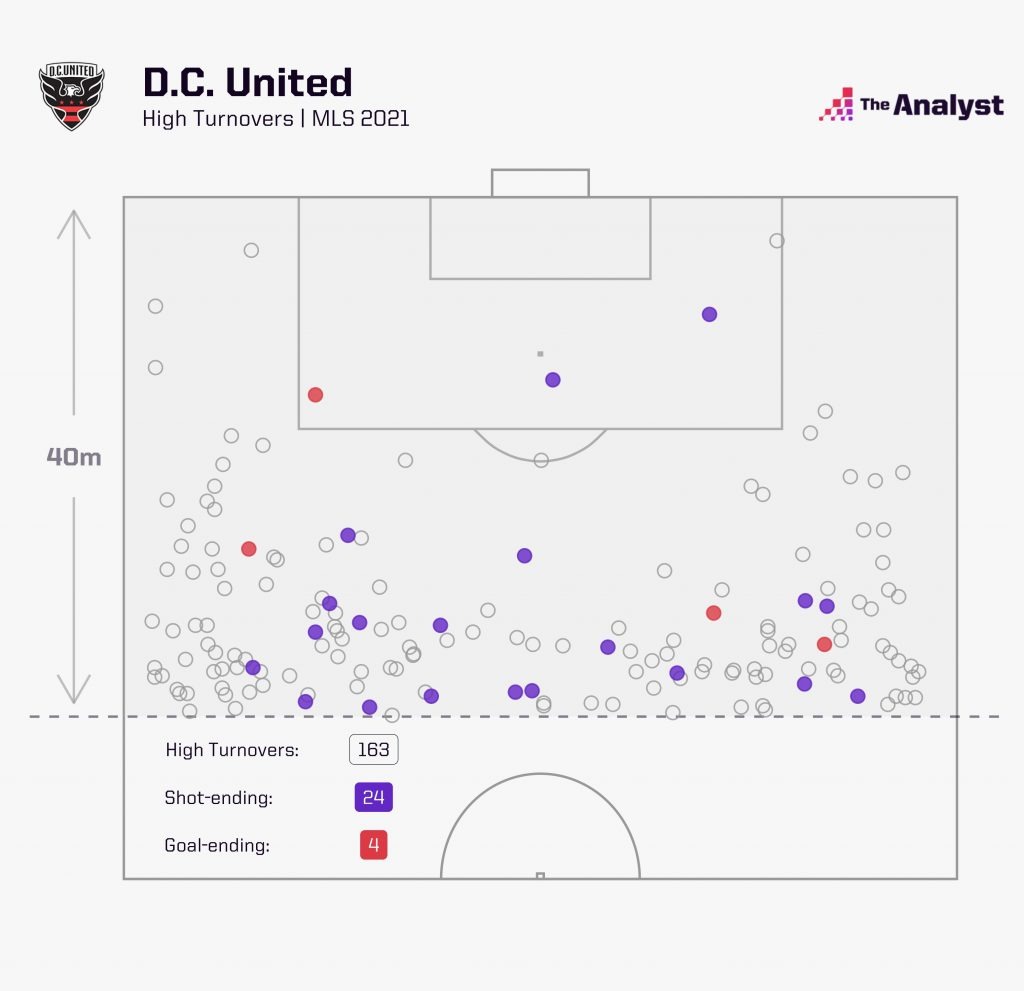
United put defenses under constant pressure, forcing opposing teams to win the ball in their half repeatedly, then capitalizing on any mistake in the wrong area of the field. Their four goals after causing high turnovers are tied for third in the league.
Considering the styles of play, we think this will put Nashville firmly in the driver’s seat. Instead of having to pull D.C. forward, United will be coming at them willingly, leaving plenty of space in behind. And Nashville are no slouches at creating opportunities from high turnovers themselves.
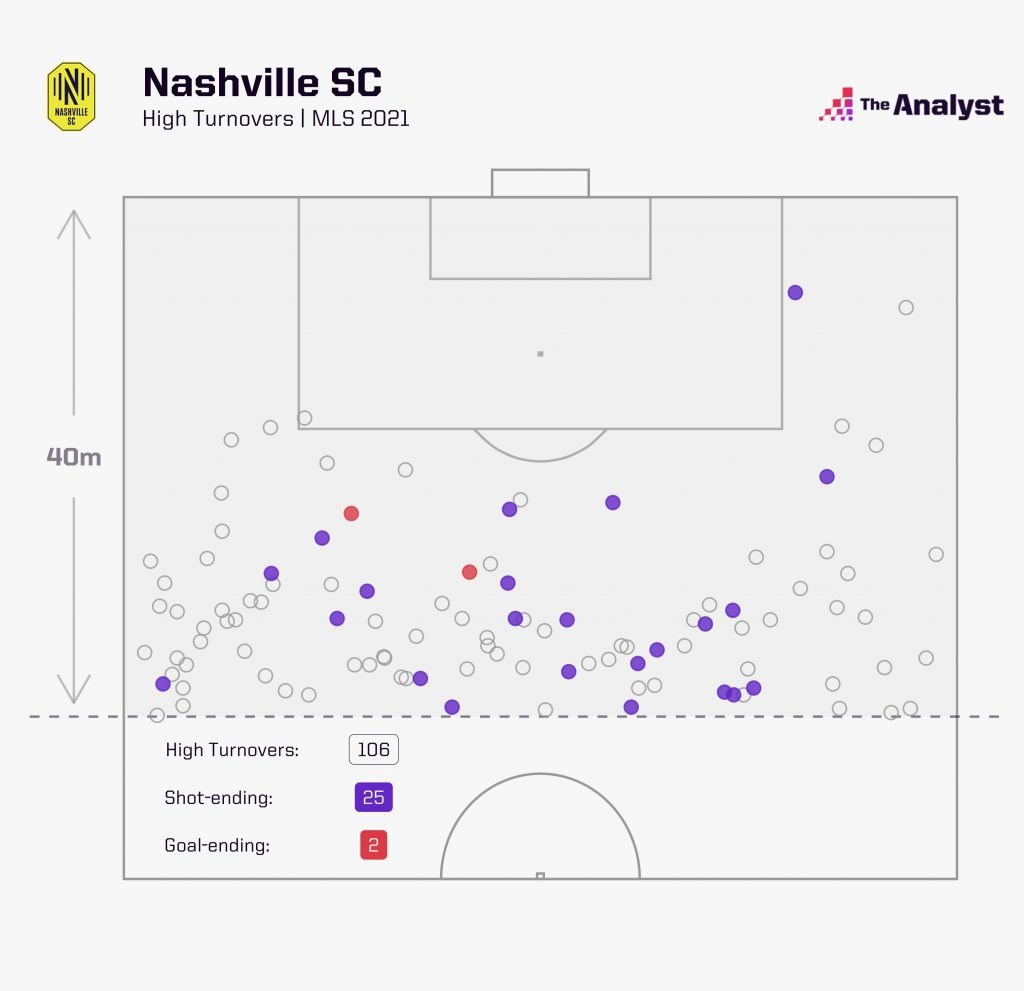
Notice they’ve created more shots from high turnovers than even D.C., despite the lack of volume. Both teams love to attack a dishevelled defense. Nashville’s penchant for sitting back won’t allow this to happen against United.
Another point to make is Nashville’s ability against a press. They’ve been pressed just about the league average – 234 sequences. However, the 66 high turnovers against means only 28% of presses attempts have worked. The 11 shots caused from those turnovers is bottom three in the league and have resulted in no goals against thus far. It will certainly be no picnic for the Nashville back three, and D.C. would love to cause the first goal against from a high turnover. Buoyed by the fact that NSC haven’t lost a game yet at home, it seems unlikely. For us, it’s Nashville’s game to lose.
Enjoy this? Subscribe to our mailing list to receive exclusive weekly content.
Design by Matt Sisneros.