
As Moneyball’s influence began to spread, basketball teams began to explore what advanced data could do for them. The game will never be the same.
In the aftermath of baseball’s analytics movement and the attention that followed, data’s influence seemed to spread to the basketball world overnight.
That’s partly because there were those who were anxious to find out if the way general manager Billy Beane and the cash-strapped Oakland A’s succeeded by embracing an analytics-heavy scouting and player-evaluation model could translate to other sports.
The A’s game-changing strategy was the subject of Michael Lewis’ 2003 award-winning book ‘Moneyball: The Art of Winning an Unfair Game’ and featured in the ’11 film adaptation that was nominated for six Academy Awards, including Brad Pitt for playing the role of Beane.
The lesson was simple: There’s deeper value in the metrics. Soon, basketball teams realized this mindset could indeed translate to the court and success could likewise be mined from the data. Because technology wasn’t yet capable of sparking an analytics revolution early on, there was no way to predict how far we’d come once ingenious basketball minds had computer algorithms, tracking and wearable technology and artificial intelligence at their disposal.
That’s not to say there haven’t been innovative thinkers who have tried to tinker with the systematic examination and evaluation of data as early as the first half of the 20th century. According to the National Association of Basketball Coaches, Howard Hobson – who had led Oregon to the first NCAA championship in 1939 – became one of the first coaches to analyze the game statistically.
He even published a book on shooting percentages and other phases of the game called ‘Scientific Basketball’ in 1949. Though his revolutionary ideas failed to catch on immediately, Hobson’s research helped lead to the eventual widening of the free-throw lane and the implementation of the shot clock and 3-point line.
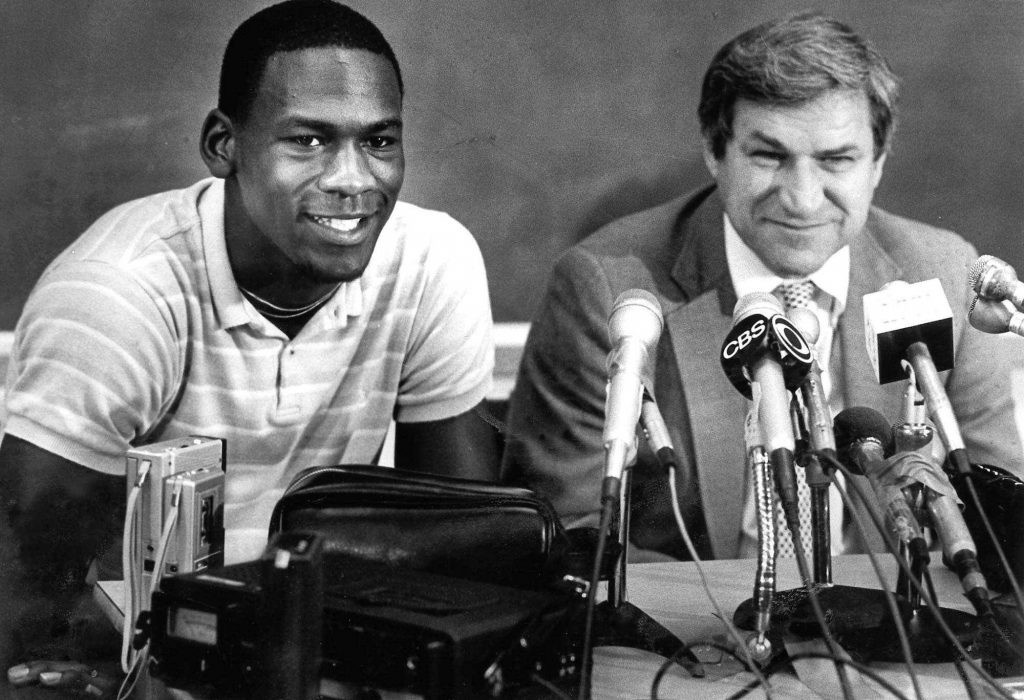
In the mid-50s, Air Force head coach Bob Spear and assistant Dean Smith, who would later become a Hall of Famer following an illustrious 36-year stint at North Carolina, created a possession evaluation system that assessed a team’s performance both offensively and defensively. Smith believed box score numbers and total points scored and allowed didn’t tell the whole story of a game partly because it failed to take into account the pace or total number of possessions.
Paul Keller, another pioneer who coached and taught math at a high school in Ohio, also felt that “points in a game actually mean nothing, but points per possession mean everything.” Keller came up with his own version of an offensive efficiency rating system in 1960 and used this metric to track Ohio State during its national title season in ’60 and runner-up finishes in ’61 and ’62.
Though Smith and other progressives continued their attempts to dig deeper into statistical analysis through the 1980s, box score-based numbers (think points, rebounds and assists) dominated the statistical landscape through the ’90s.
It was right around this time, however, that baseball fan and aspiring writer Bill James attempted to expand the thought process beyond basic stats into what he called the “ever-expanding line of numerical analysis.” Because of his work, he would become known as the Godfather of Sabermetrics – the Society for American Baseball Research (SABR).
“Any time you can add understanding to your enjoyment of something, I think it makes everything better.” – Ken Pomeroy
The tempo-based metrics created by Ken Pomeroy in the early 2000s were compared by many to James’ work in baseball. Pomeroy, the founder of the popular college basketball website kenpom.com, would eventually make a major impact on betting lines as a result of his accuracy in predicting game outcomes. His ratings are now used by not only teams in an attempt to gain a competitive advantage but also by the NCAA Tournament Committee to help determine at-large qualifiers and seeding.
“Obviously, not all fans are necessarily willing to bury their head in the numbers, but it really helps their understanding of other teams, the game itself,” Pomeroy said. “And any time you can add understanding to your enjoyment of something, I think it makes everything better.”
In the wake of Moneyball’s immense popularity, Dean Oliver similarly sought to break the mold in 2004 with his groundbreaking ‘Basketball on Paper’ during a time when modern metrics had yet to become mainstream in NBA front offices and within the fandom. Oliver’s work, which highlighted his four factors in breaking down efficiency (shooting efficiency, rebounding percentage, turnovers per possession and free-throw attempts), became a must-have handbook for basketball analysis and led to a growth in analytical blogs and websites like Basketball Reference, FiveThirtyEight and NBAstuffer.
Inspired by James’ baseball win shares and based on Oliver’s points produced and offensive possession analysis, Basketball Reference soon created its own version of win shares. Advanced box score metrics like effective field-goal percentage or EFG, usage rate, true shooting percentage, adjusted plus/minus, value over replacement player or VORP – basketball’s equivalent of baseball’s wins above replacement or WAR – and John Hollinger’s player efficiency rating or PER also came to the forefront during this statistical revolution.
As Moneyball’s influence began to spread, NBA teams considered exploring what advanced data could reveal about their team’s processes and strategies. With an eye on getting the most out of their spending, teams became more open-minded when it came to taking a closer look at not only how players performed but how their actions were impacting others on the court.
Someone like Oliver, considered by some to be the Bill James of basketball, could certainly help teams look at things differently. He was hired as a consultant for the Seattle SuperSonics in 2004 before moving on to analytical positions with the Denver Nuggets, ESPN and the Sacramento Kings, and serving as an assistant coach for analytics with the Washington Wizards.
The advanced metrics not only led to big, bold ideas when it came to in-game decision making and strategy, they also emerged as a key reference when it came to trades, contract negotiations, training practices and managing the health of players. Sophisticated models like Kevin Pelton’s wins above replacement player (WARP) projections and the FiveThirtyEight’s career-arc regression model estimator with local optimization (CARMELO) ratings became tools for prospect evaluation, draft analysis and draft-pick position valuation.
“Player tracking data is a step toward information about drawing the defense, spacing and on-ball defense. Those are steps toward player value, which is the knowledge owners pay for.” – Dean Oliver
The analytics movement reached another level in 2008 with SportVU, an in-venue optical tracking tool that was originally developed for soccer. The ingenuity of utilizing the technology for basketball proved to be a game-changer as it essentially added a third dimension to the stats that existed at the time and painted data-driven, detailed pictures of the action in a way that had never been done before.
The basketball world was now able to go well beyond box scores and event-based metrics to objectively analyze player performance. It no longer had to settle for field-goal percentage or 3-point shooting percentage as analysts could now measure which players were proficient at hitting contested jump shots, pull-up jumpers, shots in catch-and-shoot situations, and jumpers while coming off a ball screen.
The Dallas Mavericks, Houston Rockets, Oklahoma City Thunder and San Antonio Spurs had SportVU cameras installed just two years later, giving them access to positioning data for all players and the ball at a rate of 25 frames per second. As the benefits of the groundbreaking system emerged, the NBA quickly took notice and became the first American sports league to use player tracking in every game in 2013.

“It’s the culmination of a decade of the basketball analytics revolution, where different people, different methods and different data have advanced the status of basketball as a thinking man’s game,” Oliver wrote in a 2013 ESPN article. “Data is still just a step toward information, and information is just a step toward knowledge. Player tracking data is a step toward information about drawing the defense, spacing and on-ball defense. Those are steps toward player value, which is the knowledge owners pay for.”
With SportVU cameras installed in every arena, teams needed a way to interpret the avalanche of complex data coming in. As a result, computer engineers and data scientists with machine learning skills were in high demand almost overnight. Their analysis revealed new ways to measure players both offensively and defensively in situations such as isolation plays, post-ups, drives to the basket and when giving, using or going up against a ball screen. Additionally, it could identify which players were better than average passers and which excelled at moving offensively without the ball.
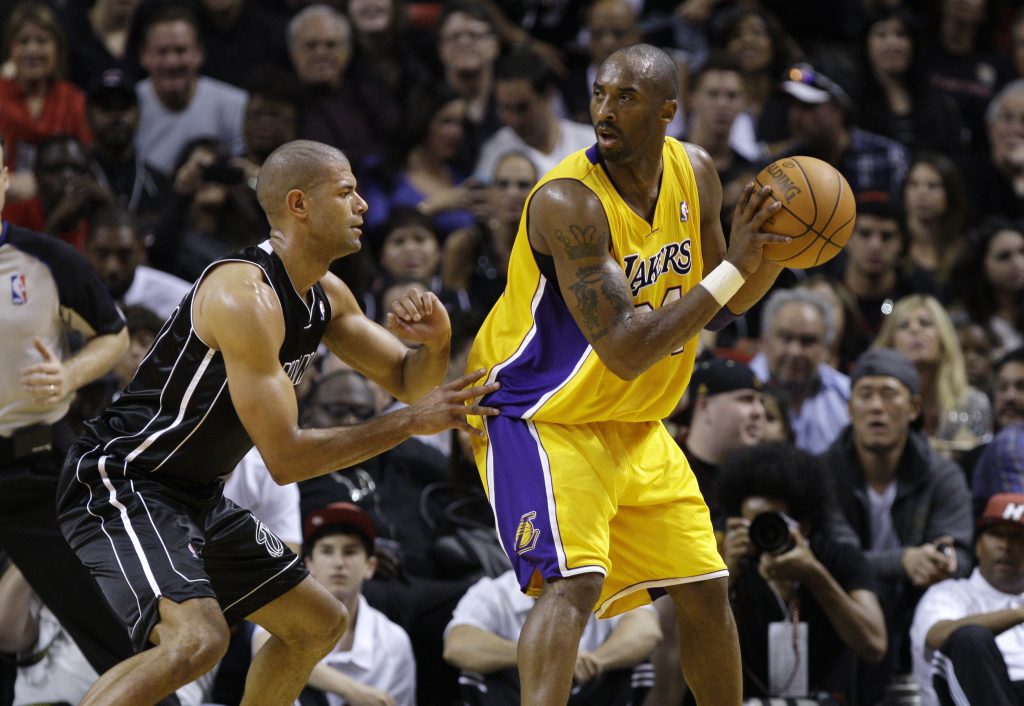
“After studying and going through the school of analytics, I knew exactly to a T who Kobe Bryant was.” – Shane Battier
The data also revealed, for example, whether a player was less effective when moving one way as opposed to another or how often a player performed a certain move when driving left or right. Shane Battier, who the analytics showed to be one of the league’s most undervalued players over his 13-year career, spoke on this for the knowledge forum Big Think in reference to how he approached defending the late, great Kobe Bryant:
“After studying and going through the school of analytics, I knew exactly to a T who Kobe Bryant was,” he explained. “The average possession of the Los Angeles Lakers in 2008 generated .98 points per possession… Kobe Bryant only shot the left-handed pull-up jumper at a 44% clip. So every time that he went left and shot that pull-up jumper he was generating .88 points per possession. Well, that’s a tenth of a point less than the average Laker possession. And so if I could make him do that time and time again, which is a lot tougher to do than to say, I’m shaving off a tenth of a point every single time… and all of a sudden those tenths of a point become points.”
With every movement on the court tracked and quantified, SportVU data would have a profound and lasting impact on how the game is played. In the aftermath of this strategic awakening, some playing styles that had previously been considered abhorrent began to be celebrated while other skills that were once championed are now enduring a slow death.
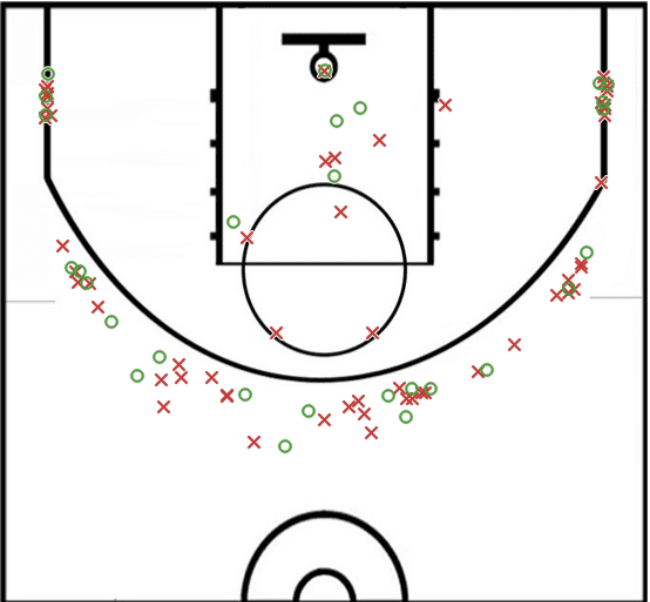
One of the biggest game-changers derived from the data stemmed from teams asking themselves: ‘Why should we shoot a deep 2-point shot that has a lower percentage of going in than a layup or dunk, but without the reward of getting an extra point?’ In simplest terms, a 50% shooter from 2-point range only needs to make 33% from 3 to produce the same amount of points. The “3 is greater than 2” mindset was born – making layups, dunks, free throws and 3s king and the long 2 a pariah.
Tracking the Rise in Possessions per Game Since 2003-04
| Season | 2003-04 | 2007-08 | 2013-14 | 2016-17 | 2019-20 |
| Possessions Per Game | 92.6 | 94.8 | 96.5 | 98.8 | 101.1 |
During Oliver’s tenure with the Kings, the franchise’s D-League team tinkered with a then-wild, data-based experiment in which the Reno Bighorns focused on shooting only 3s and layups, ran a constant full-court press, double-teamed whoever had the ball, crashed the boards, utilized five-man units over one- or two-minute shifts and attempted field goals within the first 12 seconds of the shot clock under innovative coach Dave Arseneault Jr. After a rough start in 2014-15 that led to some adjustments, the Bighorns finished first in the Western Conference the following season when six players averaged at least 14.5 points.
“You may call it really modified, but that’s what we’re trying to do (in Toronto),” Raptors NBA champion coach Nick Nurse, who had studied Arseneault’s philosophy during his time as a D-League coach, told Sports Illustrated. “We’re trying to get a lot of our players to play positionless basketball. Everyone who hits the floor shoots the 3, and we run a wide-open spacing system that tries to generate those shots. Our G League team (the D-League was renamed G League in 2017-18) is doing it too. Looking back on it, the ideas don’t seem as crazy.”
“We’re trying to get a lot of our players to play positionless basketball. Everyone who hits the floor shoots the 3, and we run a wide-open spacing system that tries to generate those shots.” – Raptors coach Nick Nurse
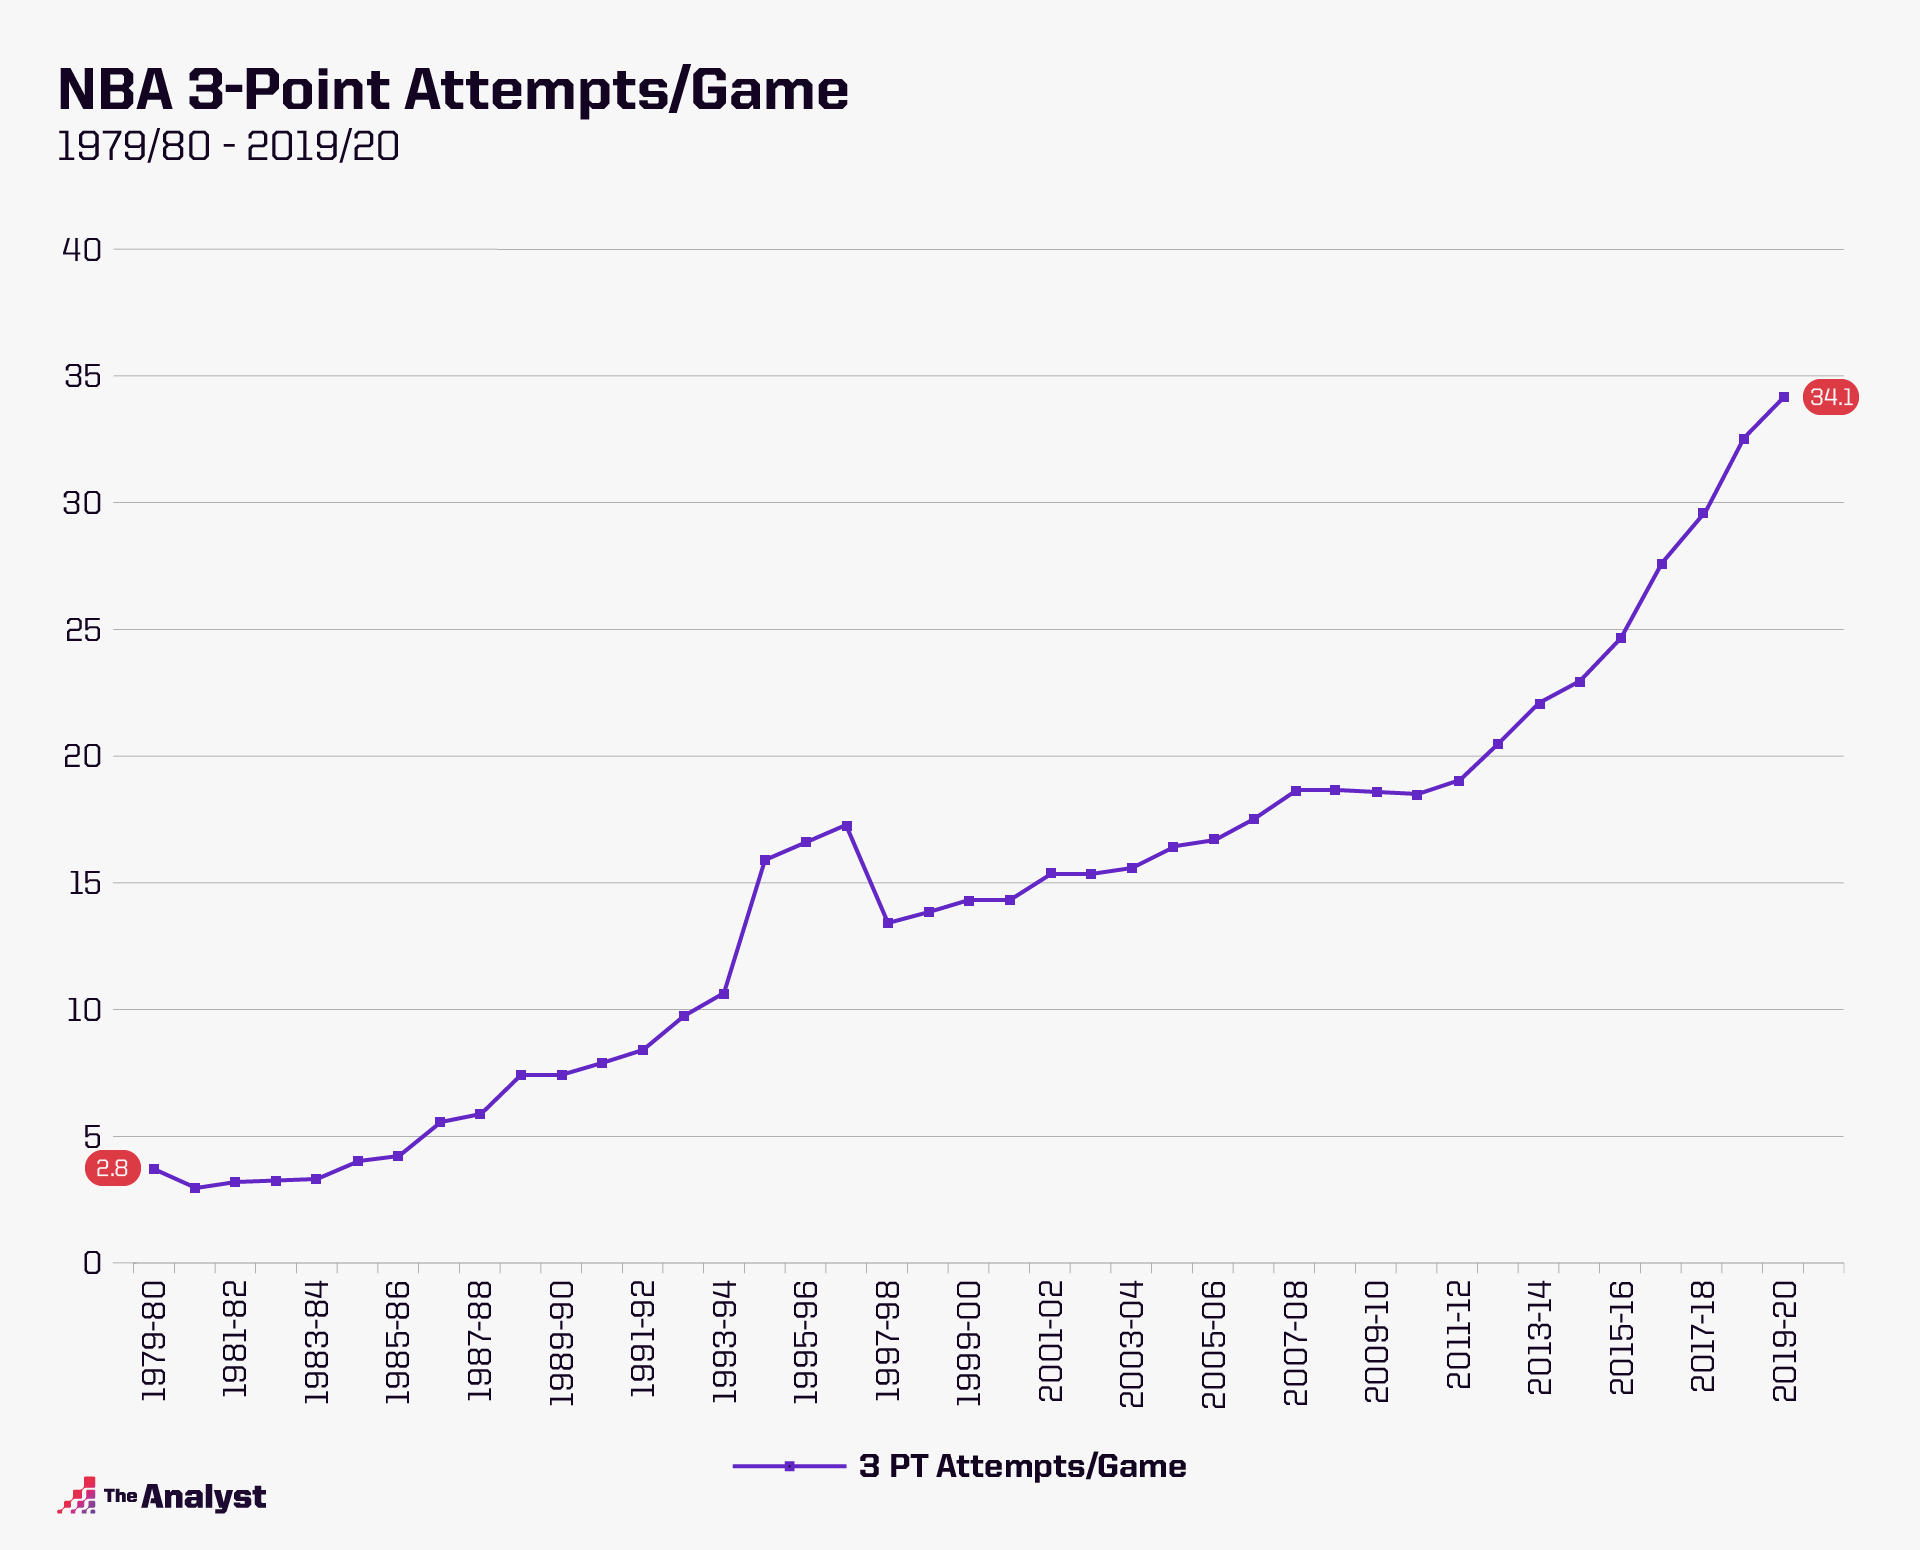
That’s because a game that had been played at a plodding pace and dominated by lumbering big men for decades suddenly saw the pace accelerate at an almost unrecognizable level and the teams’ number of 3-point attempts per game increased to an all-time high for the eighth straight season at 34.1 in 2019-20. It’s on pace to increase for a ninth straight season in 2020-21 at 34.6 per game through April 12.
Most big men of this era roam freely around the arc and have the ability to knock down 3s. At the beginning of the last decade, teams put up 18 3-point attempts per game and no club had ever put up 50 3s in a single contest. But things had changed drastically by 2018-19 when teams eclipsed 32.0 3-point attempts per game for the first time. Houston shot at least 60 four times and the Atlanta Hawks did so twice.
Stephen Curry, a 6-foot-3 guard out of Davidson, has become a superstar by sinking 3s from nearly half-court and pure mid-range shooting specialists like Calvin Murphy, Alex English and Richard Hamilton are now few-and-far between on NBA rosters.
An argument could be made that no team has embraced modern metrics more than the Rockets, and no player has represented the new data-driven playing philosophy better than 2017-18 league MVP James Harden. Houston was the first team to shoot 40.0 3-point attempts per game in 2016-17 before averaging an NBA-high 45.3 in 2019-20, just shy of the all-time record 45.4 it had set the previous season.
It is, of course, by design.
From 2007 until November of 2020 when he was named the president of basketball operations of the Philadelphia 76ers, analytics-minded general manager Daryl Morey spearheaded the Rockets’ methods, which became affectionately known as “Moreyball” as a nod to Moneyball. He created the true shooting percentage metric and co-founded the annual MIT Sloan Sports Analytics Conference. Though many teams had hired statistical-based analysts during the NBA’s analytics movement, Morey – a former statistical consultant – was the first general manager to be heavily reliant on data.
The Rockets were extremely successful during Morey’s tenure, posting the second-best record in the NBA over that span with 10 playoff appearances and two trips to the conference finals. Over that time, Harden rose to stardom after being acquired from the Thunder in October of 2012. Fittingly, Morey was the subject of Moneyball author Michael Lewis’ 2016 book ‘The Undoing Project,’ which attempted to shed light on the 2017-18 NBA Executive of the Year’s analytical methods.
“Analytics don’t work at all. It’s just crap people who are really smart made up to try to get in the game because they have no talent.” – Charles Barkley
But not everybody has been happy with the impact Morey and the analytics movement have had on the game. This became more than apparent in January of 2015 when Hall of Famer Charles Barkley went on a now-infamous rant on TNT in which he called Morey “one of those idiots who believes in analytics” and added “analytics don’t work at all. It’s just crap people who are really smart made up to try to get in the game because they have no talent.”
Commissioner Adam Silver, TV networks and fans also became a little rankled about what transpired when a global acceptance of the SportVU system led to a wider use of wearable technology. By 2015-16, more than 20 teams were using SportVU to measure and monitor the intensity, quickness and acceleration of players’ movements and combining that information with data from biomechanical devices worn during practice.
Golden State players even filled out questionnaires that asked about soreness levels, fatigue, sleep quality, and more as the team sought to maximize recovery and prevent injury. The Warriors’ training staff developed parameters for situations in which it would need to take action: a combination of fatigue and proof of diminished load capacity from the SportVU system and monitoring device. So players who became accustomed to listening to their bodies were now being told that the data knows better.
“It’s a trade-off. You want to see this guy in this one game? Or do you want to see him for three more years in his career?” – Spurs coach Gregg Popovich
“A lot of non-contact injuries are fatigue-related,” Keke Lyles, Warriors director of athletic performance from 2013-15, told CBS Sports. “If we see big drops consistently over the last few games, and we know in practice they’ve dropped and they’re telling us they’re tired and sore and beat up, then we start painting a big picture: ‘Yeah, these guys are probably fatigued.’ When they’re fatigued, they’re at a higher risk.”
This development in the ongoing evolution of the game, however, created an unwanted side effect as teams began to listen to the data and sit players who were approaching that appointed threshold. The controversial “load management” strategy became mainstream in 2015-16 when the number of benchings attributed to rest doubled league-wide.
This wasn’t an entirely new concept as Spurs coach Gregg Popovich was believed to have first started “resting” players as early as 2006. And San Antonio was fined $250,000 after unexpectedly sitting four key players for a nationally televised game in 2012.
“It’s a trade-off,” Popovich told fivethirtyeight.com. “You want to see this guy in this one game? Or do you want to see him for three more years in his career? And do you want to see him in the playoffs because he didn’t get hurt because maybe he got rest?”
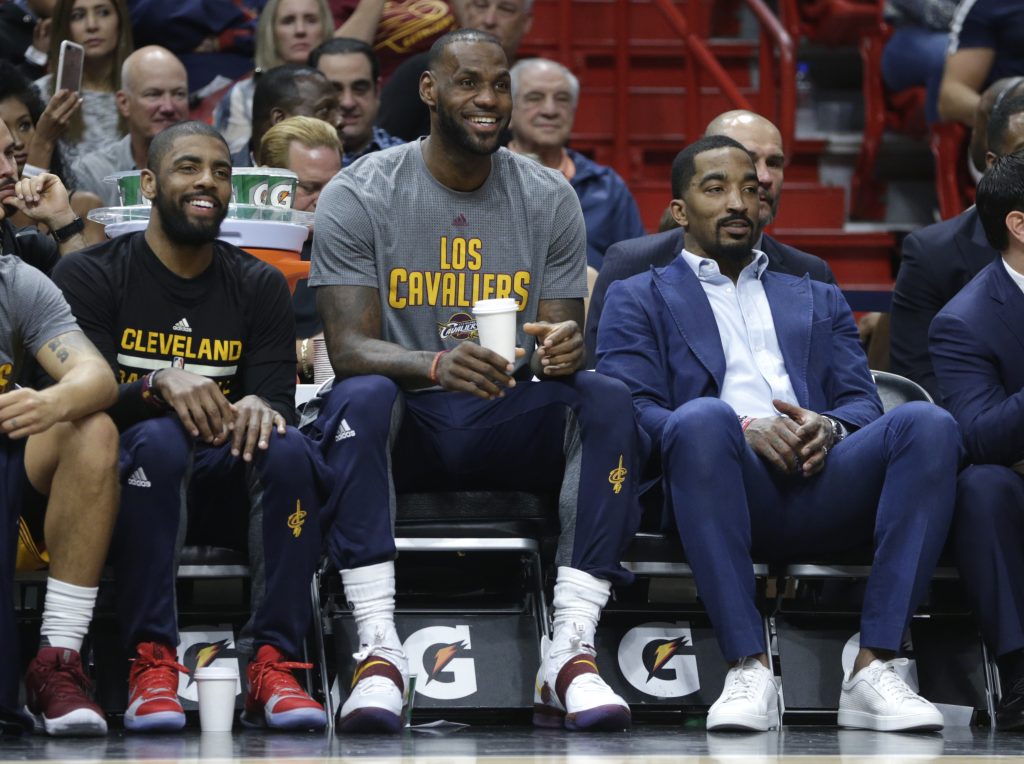
Resting players was one thing, but now teams were actively employing a program to monitor the physiological stress players endure over the course of a season and keeping them sidelined when deemed necessary. Things came to a head in 2017 when the commissioner sent team owners a memo that called the practice of resting healthy players an “extremely significant issue” after the Cleveland Cavaliers sat LeBron James, Kyrie Irving and Kevin Love in a nationally televised game against the Los Angeles Clippers.
In September of that year, the NBA announced new legislation that gave Silver the ability to fine teams for resting players in several instances, including multiple players outside of unusual circumstances in a single game, and healthy players in nationally televised games. Any violation was to be deemed as conduct detrimental to the league and subject to a fine of at least $100,000.
The commissioner attempted to meet teams halfway in the load management debate by lowering the average number of times a club has to play on consecutive days. The league average was 12.4 back-to-backs in 2019-20, way down from 19.3 five years ago. Still, load management has seemingly become more accepted as Kawhi Leonard and some media outlets praised the Raptors for their health management of Leonard, who led the franchise to its first title after playing in just 60 games during the 2018-19 regular season.
“Loading management is about lowering the threshold of load on a player so that he’s able to recover and decrease the risk of injury or chronic fatigue,” Dr. Marcus Elliott, founder and director of the Peak Performance Project, told ESPN.
Selecting a player like Kawhi in the draft can be a game-changer for a franchise, while the wrong move could set the organization back for years. Almost $163 million has been committed to 2019 lottery picks over two-year contracts, but nearly a third of 2011-16 first-round picks are out of the league, including 10 of 84 lottery picks.
This leads one to wonder if the next big wave of analytics could come from technology that’s able to evaluate prospects in ways that have never been imagined. With so much at stake, making selections based on medical histories, physical measurements, skill evaluations and past performances isn’t enough. Stats Perform, which had previously brought SportVU to the forefront, sought to move beyond in-venue technology to produce tracking data off of broadcast footage with AutoStats.
With this technology, it’s finally possible to better compare LeBron to Jordan in a variety of different aspects of the game. And by measuring past NBA picks, the AI can use that data to better predict how future draftees will pan out. Since February of 2019, the Orlando Magic have had exclusive rights to use AutoStats data that previously didn’t exist to help analyze collegiate players and improve player evaluation.
“In the 2020 draft, we drafted Cole Anthony and we had used AutoStats to assess his performance at North Carolina,” Magic director of basketball analytics David Bencs said. “It was well documented, even publicly, that he was playing for an under-talented team that lacked shooting and didn’t provide enough space for him to operate. With AutoStats, we were able to isolate his performance from his teammates better.”
That’s not to say that in-venue camera technology hasn’t carried on. Current NBA tracking technology brings analytics to the fans. Los Angeles Clippers fans have been able to use Second Spectrum’s CourtVision app to view Xs and Os of the offensive plays, real-time shot-making percentages as the player moves on the opponent’s half-court and other visual effects.
The FIBA Connected Stadium has also emerged through a partnership between Synergy Sports and the International Basketball Federation. It utilizes the latest automated technology to capture live games and enhance broadcasts with commentary and visual overlay graphics.
With a growing number of Power Five schools and NBA franchises as clients, Noah Basketball is also contributing to player evaluation. The Noah system uses cameras and sensors to identify and analyze aspects of shooting, including the arc, ball rotation, depth, left-right aim and even biomechanics of the player’s form.
Technology continues to spread across sports as fast as it ever has, and expect basketball to be one of the major players during the next analytics craze.
Research support provided by Stats Perform. Zachary Moore contributed.