In this installment of a series on advanced football metrics, we look at run disruption rates to discover how individual players are able to impact the run game on either side of the ball. Check out our NFL advanced leaderboard here.
It’s one of the most difficult relationships to evaluate in football.
We often settle for using various tackle statistics in order to find which players are making the most plays at or behind the line of scrimmage, which leads to a few problems.
First, this approach gives no credit to defensive players blowing up run design and rerouting the ball carrier into a different defender. Much like a sack caused by an initial pressure that flushed the quarterback, the best way to evaluate the play is to identify which player(s) were able to affect the play, even if they didn’t necessarily end up in the box score.
Second, not all positive plays for a run defender will result in a minimal gain for the offense. Much like it is possible for a defender to record a hurry on a pass play that results in a 40-yard gain, sometimes an offense is able to overcome an extraordinary effort by a defender and still deliver a successful play. Without finding a better way to measure that action, we’re not giving that defender credit.
There are even fewer reasonable metrics for evaluating blockers on run plays. The average fan has no ability to determine how good or bad a lineman is at run blocking outside of using their own eyes or relying on a player’s reputation in the media.
Enter the run disruption metric. On each rushing play, video scouts look at each player on the field and record which defender or defenders were able to go above and beyond their responsibilities to beat the blocking scheme and disrupt the design of the run, as well as the blocker or blockers that allowed said defender to win their matchup.
Players don’t need to make the tackle in order to receive credit for a disruption, and the play doesn’t have to be a loss or short gain from the offense. If Aaron Donald is able to toss his blocker to the ground on an inside zone and force the running back to bounce outside, but no one is able to keep him contained and he gains 15 yards and a first down, Donald is still credited because he disrupted the original run concept the offense was trying to execute.
With this in mind, a player’s total number of disruptions is divided by the number of snaps on which he was in position to potentially affect the play in order to determine their run disruption rate (RD%). Using 2020 data as an example here, these breakdowns only include a player’s rate in the snaps they were lined up at the given position.
Nose tackles are the most impactful players in the run game, with an average disruption rate of 20.1%. Though NTs don’t matter as much and often aren’t on the field in passing situations, Dalvin Tomlinson still managed to top his position in both pressure rate and run disruption rate.
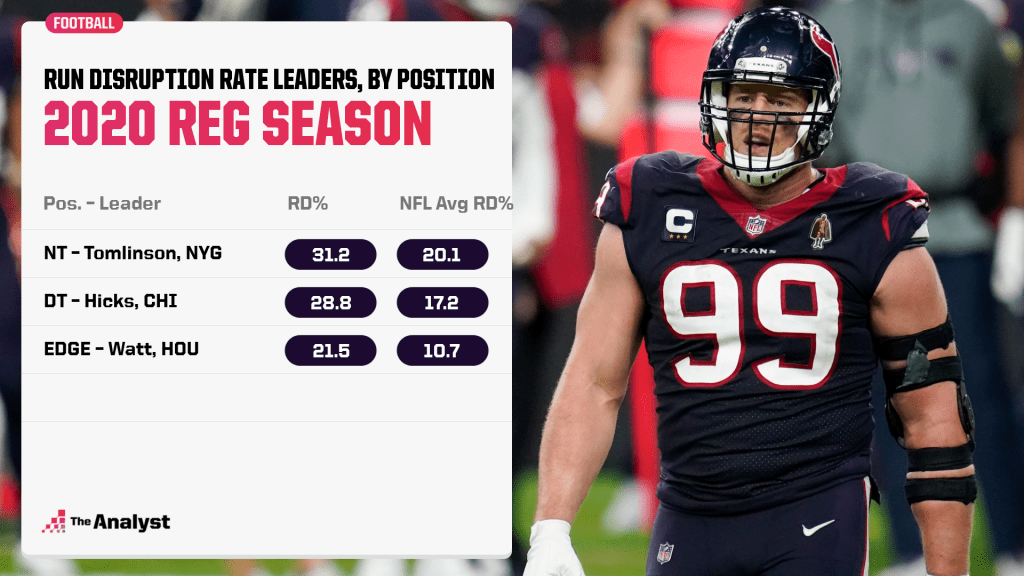
As logic would indicate, edge defenders are the least impactful players in the run game on the defensive line, with a disruption on a little more than one of every 10 run snaps. Though he’s on the back end of his outstanding career, J.J. Watt proved to still be effective against the run with a position-best 21.5 RD%.
We’ll now switch sides of the ball and look at run disruption-allowed (RD-A%).
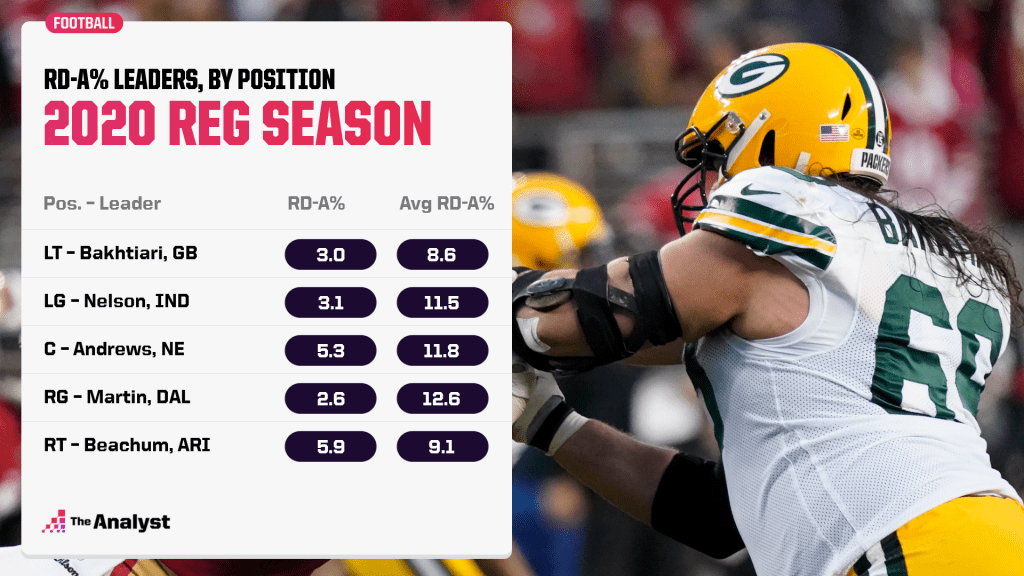
As mentioned in the breakdown of our pressure metrics previously, run blocking is far more important than pass blocking at the center position because centers are the ones most often tasked with blocking nose tackles. Much like NTs and DTs on the other side of the ball, the average RD-A% among guards and centers is extremely similar.
It’s worth noting that David Bakhtiari of the Green Bay Packers was not only elite against the run in 2020, but he also led all left tackles in pressure allowed percentage. That’s why it was such a big blow when he went down with a season-ending knee injury ahead of the team’s regular-season finale that year.