For more than 20 years Stats Perform has recorded detailed event data to provide a snapshot of every action at any moment during a football match. By analysing the sequences of events that constitute a period of possession, we can create and utilise a whole suite of new metrics to gain insight into a team’s playing style or an individual player’s contribution.
By stringing events together, we are able to value the contributions of the players who don’t necessarily score or assist goals but are still integral in the build-up. While secondary assists (the pass before an assist) provide some of this context, we can now go even further back with sequences and see who is starting these moves or who is most frequently involved before these final actions.
What Are Possessions and Sequences?
Sequences are defined as passages of play which belong to one team and are ended by defensive actions, stoppages in play or a shot. A sequence starts with a player making a controlled action on the ball. This includes passes but not defensive events such as tackles and interceptions, unless these events are followed by a controlled action such as a pass or dribble.
Possessions are defined as one or more sequences in a row belonging to the same team. A possession is ended by the opposition gaining control of the ball.
A series of uninterrupted passes leading to a shot would be counted as a sequence. The shot ends this sequence but suppose the keeper saves it and pushes it out for a corner. Although the sequence ends, the possession continues until the opposition gains control of the ball. The original sequence and the sequence initiated from the corner would both be included under the same possession for the team taking the shot.
It’s worth noting some important features of this model:
- Some events do not belong to any sequence or possession in the match. The save in the example above does not initiate a sequence and so is not included within the framework.
- For the same reason, not every second of a match where the ball is in play is marked as belonging to a particular team.
- The total number of possessions belonging to each team in a given match can only differ by one. If a possession for one team ends, the other team has gained control of the ball and hence started their own possession.
- On the other hand, the length of these possessions (in terms of the number of sequences and the time elapsed) are not necessarily equal.
We will focus on sequences for our examples given that they allow for increased granularity in our analysis and derive more intuitive metrics for players and teams.
What Do Sequences Tell Us?
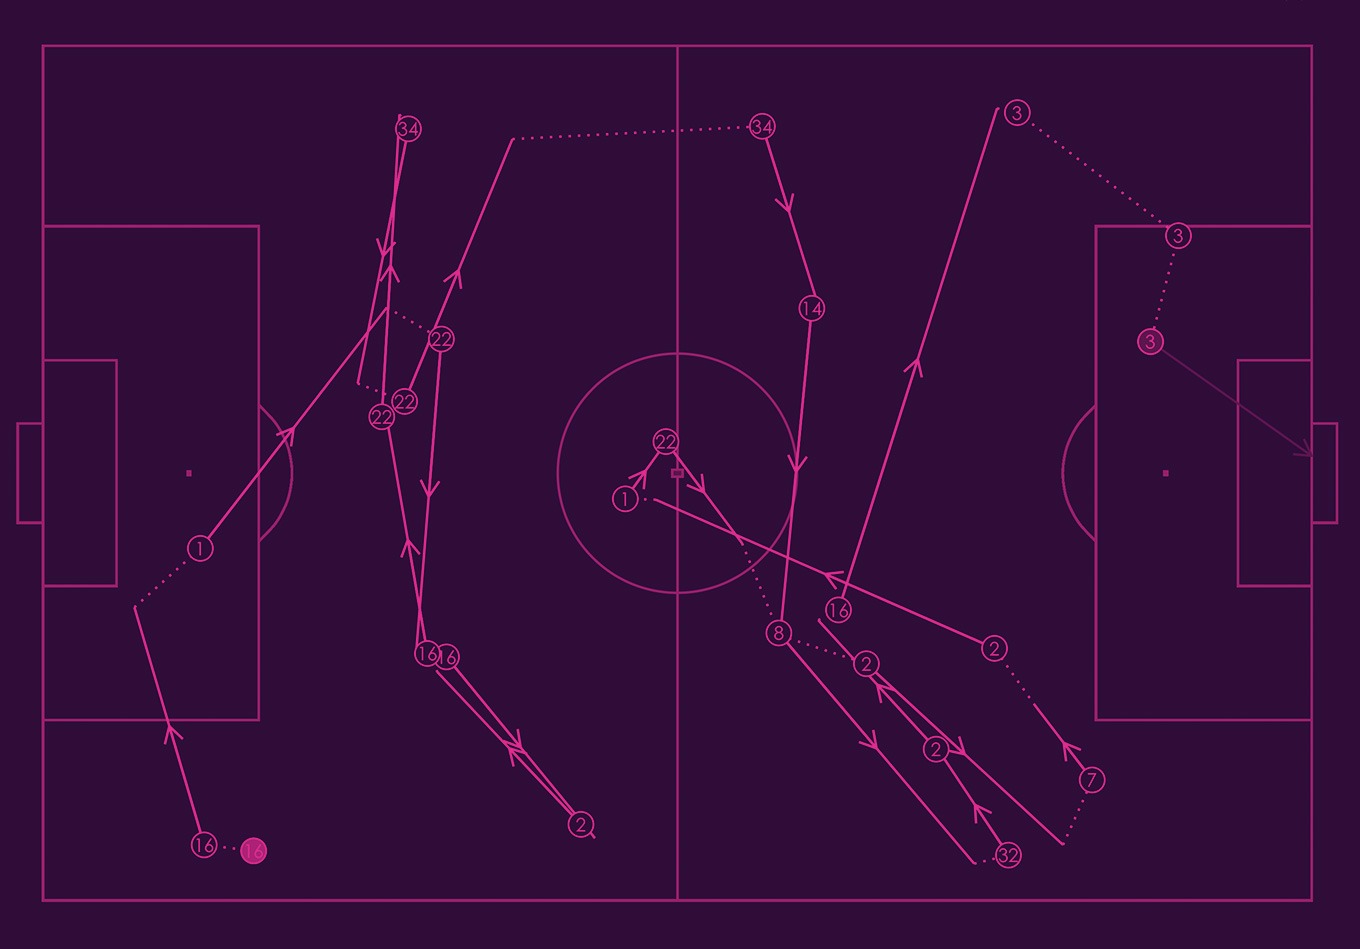
Let’s consider the passage of play leading to Arsenal’s Martin Ødegaard’s first Premier League goal in the North London derby against Tottenham. The sequence starts with Arsenal’s goalkeeper, Bernd Leno, whose pass is a controlled action that initiates the sequence following an unsuccessful flick on by Harry Kane. After a succession of short carries and direct passes through midfield, Kieran Tierney beats Matt Doherty and squares it for Ødegaard to score. Ødegaard’s shot concludes the sequence.
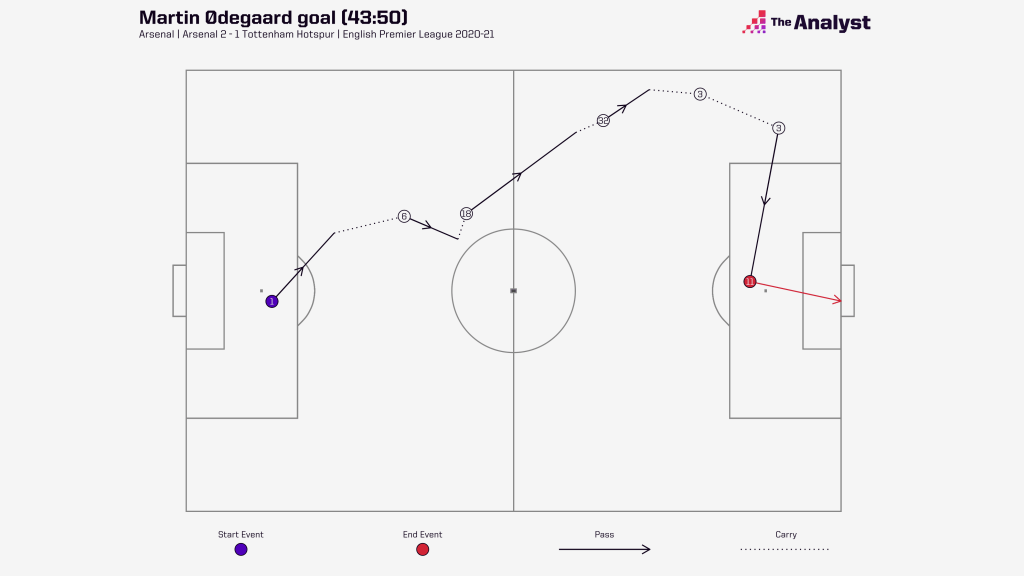
We can see that Bernd Leno (number one) initiates the sequence in his own area and that nearly 22 seconds elapsed in the build-up to Ødegaard’s shot (number eleven). The sequence traced between all events covered 142 metres, or 72 metres if we consider only the distance progressed directly up-field. Within this sequence, there were six players involved and we can identify the number of passes in the build-up to this shot (5).
How Do We Use Sequences?
We have seen that the sequence framework can provide context about an event that isn’t possible through event data alone. We can aggregate this context for a team or player and define even more metrics upon this information to give us new ways to evaluate their performances.
Sequence Metrics for Players
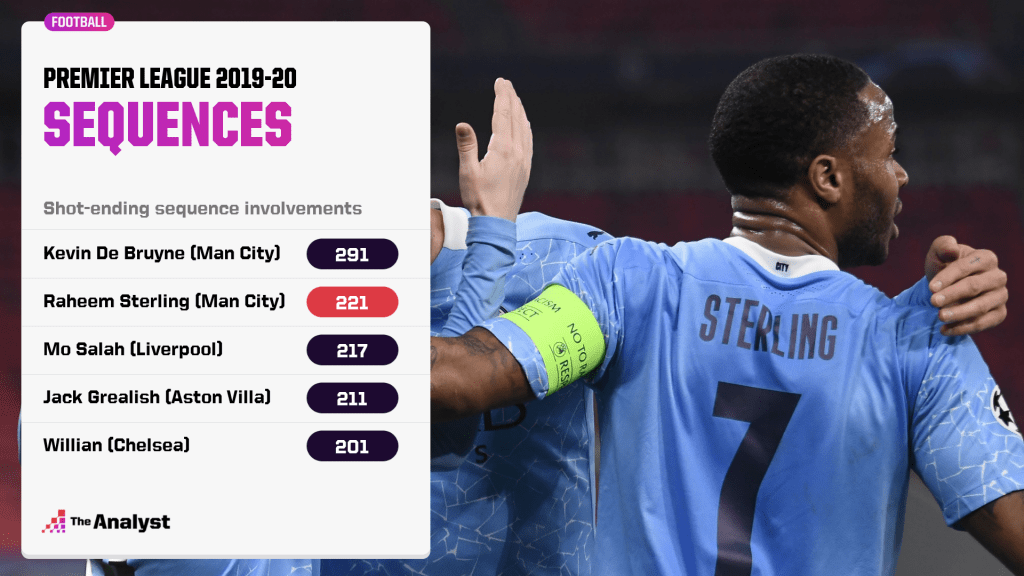
As we alluded to earlier, we can quantify a player’s involvement in sequences that end in shots. Manchester City’s Raheem Sterling was involved in 221 unique sequences that ended in shots. Despite only registering one assist in the Premier League 2019-20 season, his teammate Kevin De Bruyne was the only player to outperform him in this metric (291). Even if we remove the times where Sterling played the pass immediately before the shot or took the shot himself, we find that he ranks in the top five percent of players. Sequence involvements allow us to value a player’s importance to the team even if they didn’t perform strongly in their traditional numbers.
Player sequence metrics aren’t just valuable for attackers. With event level metrics, you might analyse players regaining possession of the ball with metrics such as interceptions, ball recoveries or tackles. What we can do with sequences is look at the context of what happened after these events.
Using a metric derived from the sequence data, we find that no player in the Premier League 2019-20 season regained possession and initiated shot ending sequences more times than Leicester City’s Wilfried Ndidi (17). This metrics illustrates how Ndidi not only wins the ball back for this team, but also initiates attacking moves from these actions.
Sequence Metrics for Teams
Each team plays differently, and their style is typically hard to quantify. With stylistic metrics derived from the sequence framework, we can now compare how teams typically move the ball. The graphic below shows how Premier Leagues 2020-21 teams currently compare in terms of their number of passes per sequence and direct speed, where direct speed is the average speed of ball movement towards the opponent goal line during a sequence.
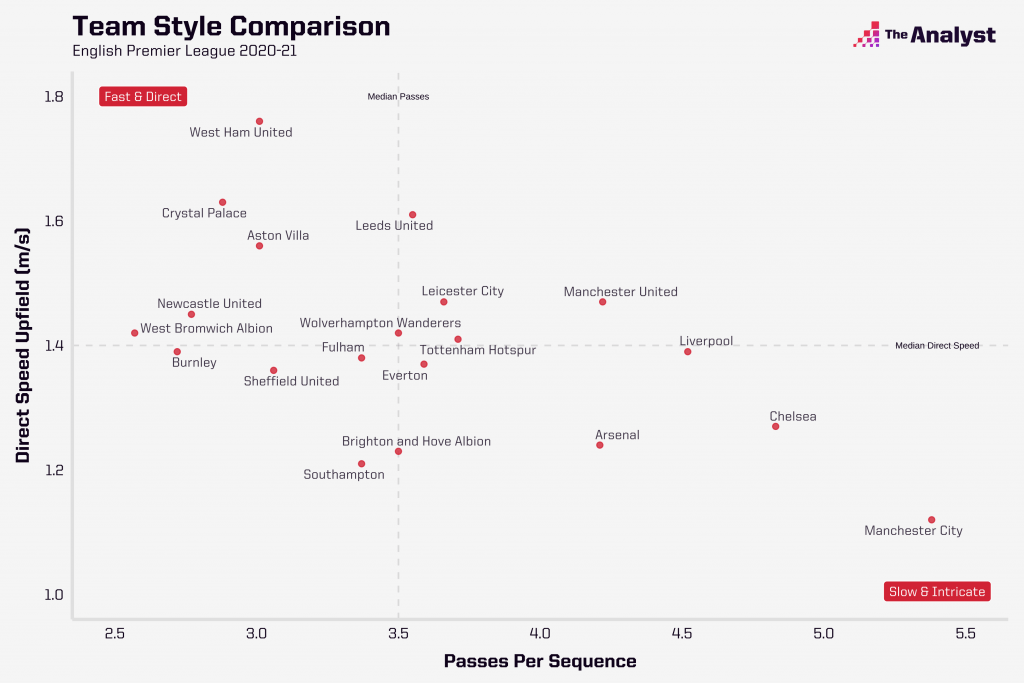
Unsurprisingly Manchester City are out on their own. They play almost three more passes per sequence than West Bromwich Albion at the other end of the scale and are patient with progressing the ball up the pitch. Comparing teams like this gives a high level overview of how their style of plays contrast, with similar teams clustering according to their directness and passing tendencies.
There are over 40 bespoke sequence metrics that allow us to evaluate players and teams. Some of the most popular of these bespoke metrics are listed below:
- High turnovers: The number of times a team won possession in open play within forty metres of the opponent goal. Liverpool had the most high turnovers (406) in the Premier League 2019-20 season.
- 10+ pass sequences: The number of open play sequences that contain ten or more passes. Manchester City had the most 10+ pass sequences (921) in the Premier League 2019-20 season, 239 more than their closest rivals Liverpool.
- Build up attacks: The number of open play sequences that contain ten or more passes and either ends in a shot or has at least one touch in the box. Unsurprisingly, Manchester City were also the most effective at converting these passing sequences into effective attacks with 252 in the Premier League 2019-20 season.
- Direct attacks: The number of open play sequences that start from just inside your own half and have at least 50% movement towards the opposition’s goal and ends in a shot or a touch in the opposition penalty box. In the Premier League 2019-20 season, Manchester United had more direct attacks (82) than any other team.
Stringing Events Together
Historically, metrics have often revolved around independent snapshots in time such as a pass or shot event. Stats Perform’s possessions framework strings together consecutive events into sequences in order to provide a more detailed picture of what’s happening on the pitch.
Looking at the game through sequences allows us to more effective analyse players whom it might have been difficult to give credit to in the past. It also allows us to quantify a team’s stylistic features from event data in both frequency and effectiveness. Sequences offer us a level of insight that help develop a more informed understanding of player roles and team style.