Which other teams are underperforming over the first third of the season? Which have played over their heads so far? We’ve dug into our database and used an expected win-loss model to answer these questions and more.
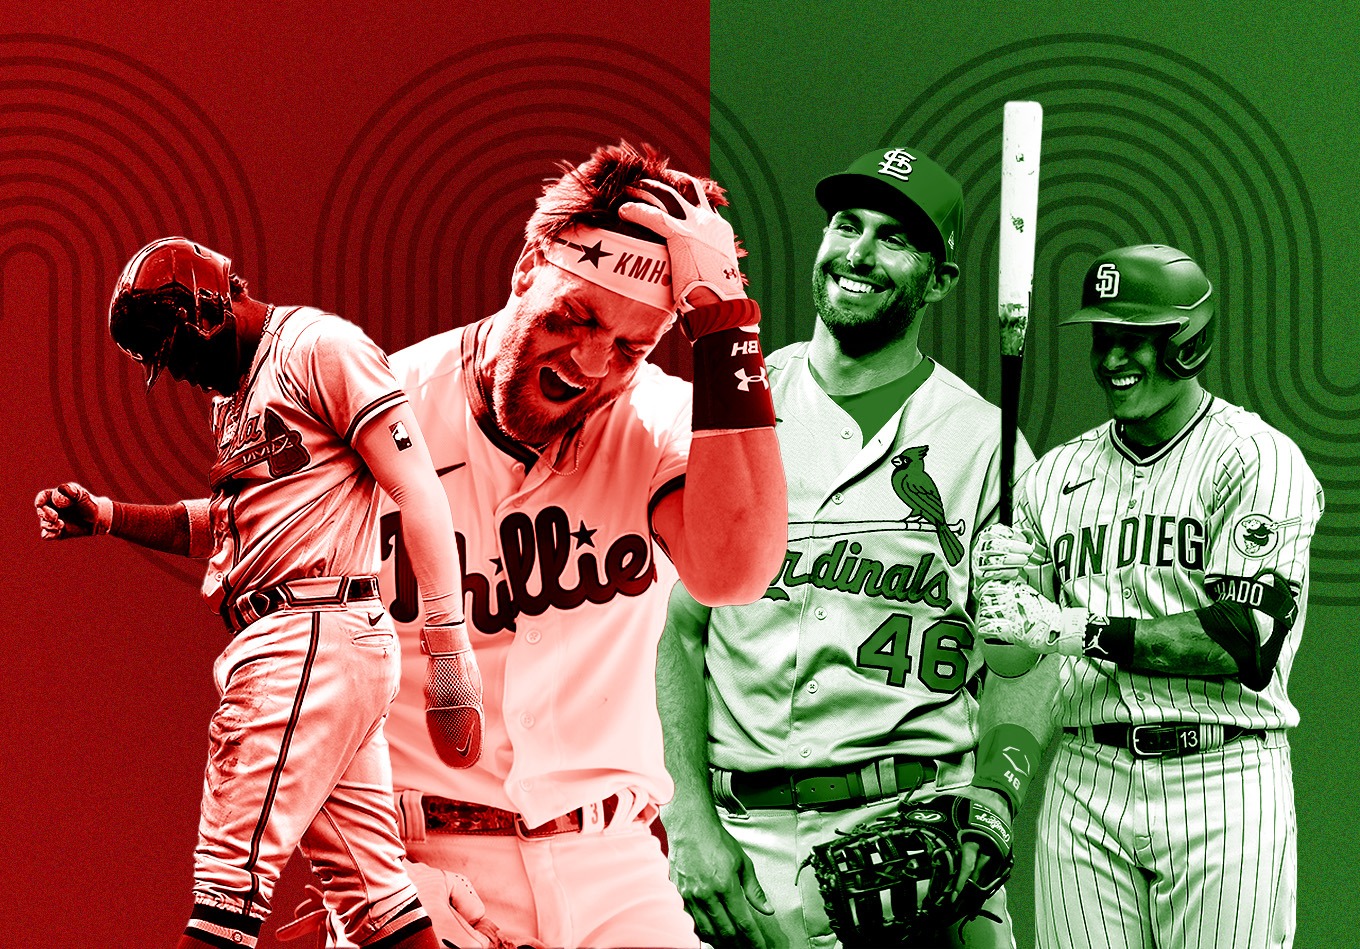
They already had two ace-caliber pitchers and five total 2021 All-Stars, including the NL MVP, so it’s safe to say more was expected from the Philadelphia Phillies after landing two of the biggest offensive prizes of free agency.
But Kyle Schwarber, who signed a four-year, $79 million deal, is batting .197 with 14 home runs and a 128 raw value+ (RV+) entering the week. Nicholas Castellanos is hitting .244 with seven home runs and a 118 RV+ after inking a five-year, $100 million contract. It’s also a far cry from the 144 RV+ he posted a year ago with the Cincinnati Reds.
It certainly hasn’t helped that reigning MVP Bryce Harper has been troubled by a right arm issue that has forced him to serve as the designated hitter or that infielder Jean Segura is out for three months with a broken finger.
As a result, a disappointing 22-29 start and a 12-game deficit in the National League East led to the dismissal of veteran manager Joe Girardi before interim skipper Rob Thomson led them to a sweep of the free-falling Los Angeles Angels over the weekend.
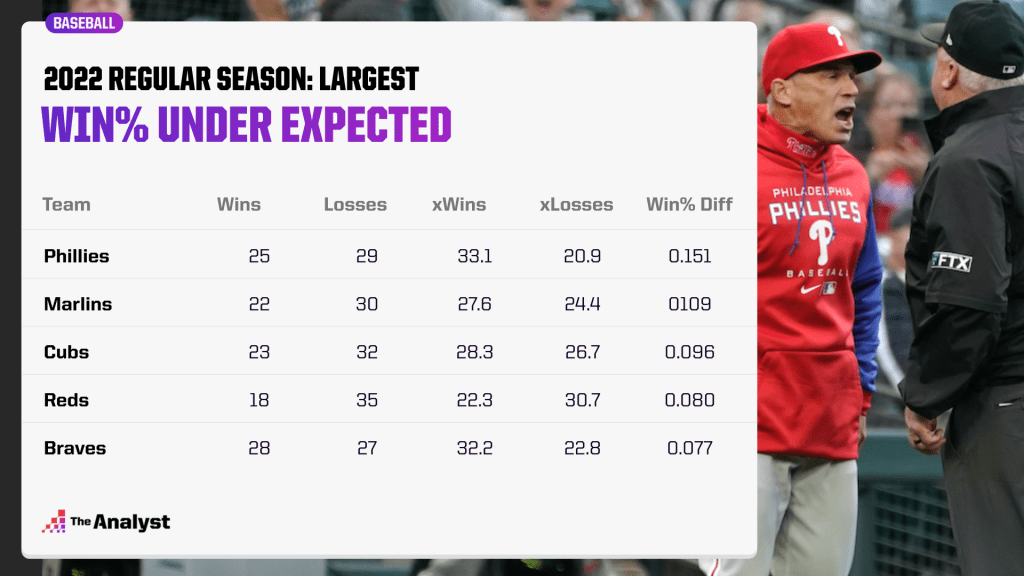
Having said all that, the Phillies headline our list of the biggest underperformers with the biggest difference in expected winning percentage and actual win percentage a third of the way through the season. Despite their shortcomings and disappointing start, they still rank fourth in MLB in our adjusted team rankings.
Our adjusted team rankings are derived from a model that combines each player’s RV data and calculates a total for each club with the league average being 100. RV+ examines how a hitter performs throughout each pitch of an at-bat rather than just the result, while RV- does the same for a pitcher.
So the Phillies have won eight fewer games than their expected record for a .151 winning percentage differential that’s top in all of baseball. And that’s despite having one of the best team RV numbers in MLB. How did we figure this? By estimating how many runs each team would score and allow based on their RV and converting that into a winning percentage.
Why that’s the case for the Phillies is difficult to determine. But in most cases, it has to do with some combination of bad luck, poor defense at the wrong times and a lack of timing hitting or pitching performance.
Defensively, Philadelphia is tied for the 10th-most errors (34) and ranks 20th in fielding percentage (.983). And it’s not so much the timely hitting as it appears to be the timing pitching performance that has mattered.
The Phillies have allowed a .246 batting average in close and late (seventh inning or later with the batting team ahead by one run, tied or with the tying run on base, at bat or on deck) situations so far – the 25th-highest mark. And they’ve posted a 3.82 ERA in one-run games that also ranks 25th in the majors and allowed the fifth-highest batting average (.287) with runners in scoring position.
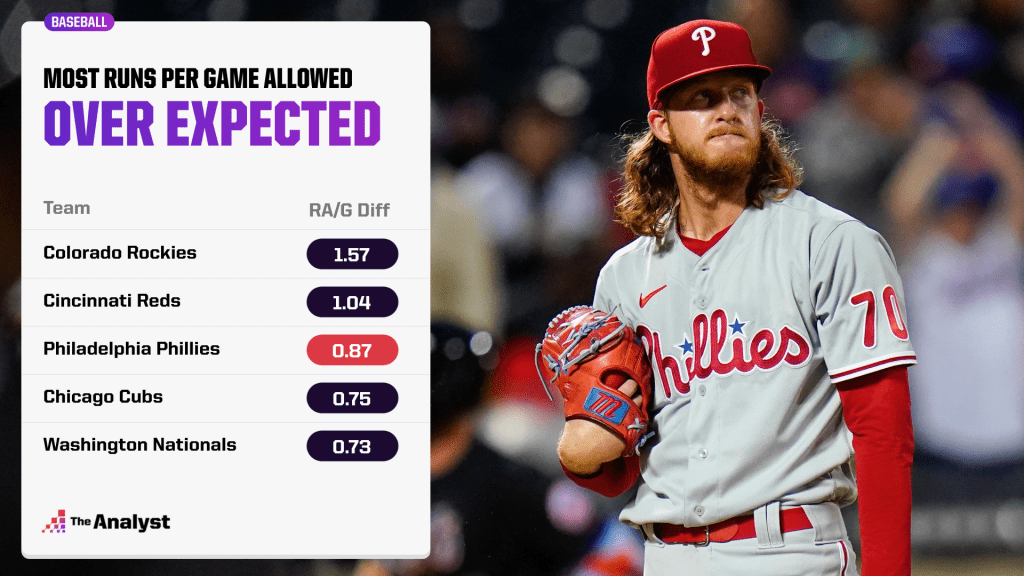
The combination of these two factors is part of the reason why the Phillies have allowed 0.871 runs per game more than the expected amount, according to our model. Only the Cincinnati Reds and the Colorado Rockies have given up more.
But all this also means there’s some regression to the mean that could come into play over the remainder of the season. If the Phils perform the way our model has expected them to (that is, at a .614% clip) thus far, they’d finish the season with a 91-71 record that would be good enough to contend for a playoff spot.
Only the New York Yankees (.743), Los Angeles Dodgers (.669) and Houston Astros (.615) have a higher expected winning percentage entering the week.
Which other teams have been the biggest underperformers, per our model? Rounding out that top five are the Miami Marlins, Chicago Cubs, Reds and Atlanta Braves, who are 28-27 but could be in line for another mid- to late-season push with an expected win percentage at .586.
On the other side of that spectrum, three teams in playoff position top our list of overperformers through the first third of the season. The St. Louis Cardinals have an expected record of 25-30, but they’re 32-23 and in second place in the NL Central entering the week.
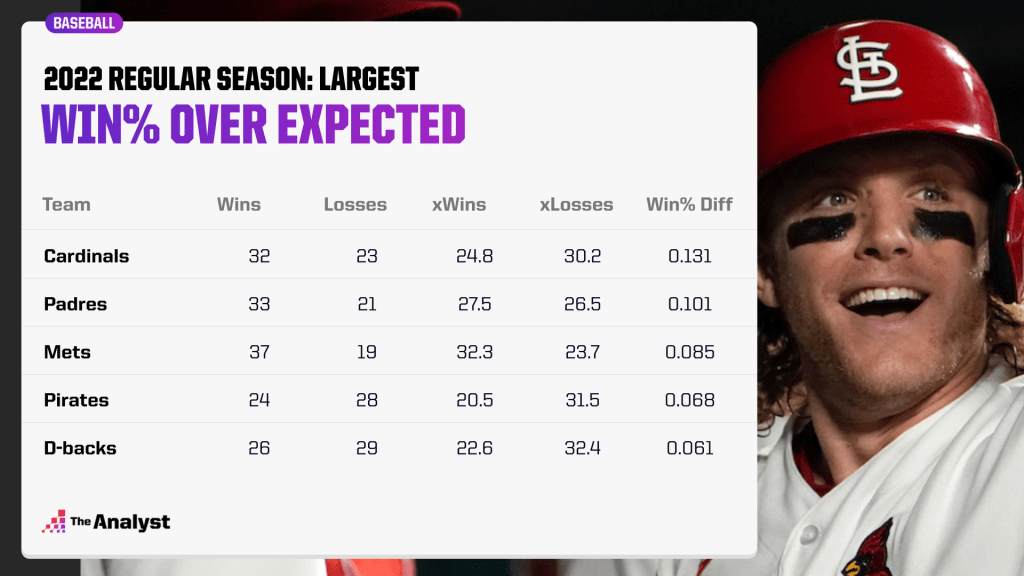
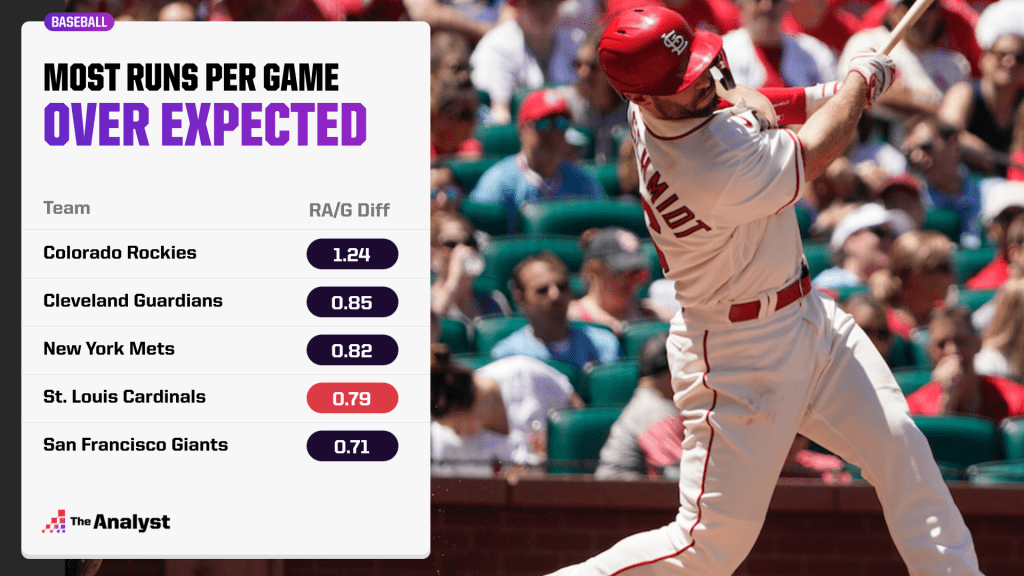
The Cardinals have hit .285 with runners in scoring position – well ahead of their .254 overall team batting average. That trails only the New York Mets (.291), who not coincidentally rank third on our list of the biggest overperformers.
They also rank sixth in close and late batting average (.257) – just ahead of the San Diego Padres, who are second on our list of the biggest overperformers.
Both the Mets and Cardinals are scoring way more runs per game than expected, but St. Louis is also allowing fewer than expected. The Mets and Cards rank third and fourth, respectively, in runs per game scored over the expected at plus-0.816 and plus-0.789.
At the same time, St. Louis is second with 0.618 runs allowed per game under expected to the Houston Astros (0.621).
The St. Louis pitching staff has also come through in key situations, holding opponents to a .192 average in close and late situations – second only to the Tampa Bay Rays (.191) – and a .223 average with runners in scoring position (sixth in MLB).
So if the Cards were to play at their current expected winning percentage for the remainder of the season, they’d finish just 80-82 and likely out of the playoffs. Remember, St. Louis was just 71-69 last season before putting together a 17-game winning streak that propelled them into the playoff picture.
But then again, that’s why they play the games.
Graphic design by Briggs Clinard.
Enjoy this? Subscribe to our mailing list to receive exclusive weekly content.