
Cricket is a notoriously difficult sport to predict. No matter the pre-game favourites, a handful of quick wickets can irreversibly swing a five-day Test match towards the bowling team. Similarly, what appears to be a meandering limited-overs run chase can be transformed by one expensive over.
In this article, we introduce three new cricket metrics developed by Stats Perform, which are designed to quantify the current match situation and predict future outcomes:
- Live Win Probability – a live model predicting win/loss/draw percentages.
- Score Prediction – a live projection of the final innings scores posted by each batter and the batting side as a whole.
- Next Ball Predictor – a live prediction for the likelihood of outcomes for the next ball, such as the probability of a six or likelihood of a wicket.
These metrics update after each delivery and have been designed to be applied at scale for domestic and international cricket across all formats (excl. 10 over matches), for both the men’s and women’s game.
How Do We Calculate Live Win Probability and Score Predictions?
Two of the main goals for our initial cricket simulation models were that all three metrics were completely linked, and second, that they could be applied to any of the live cricket data collected by Stats Perform, whether it be an international women’s T20 or a domestic men’s first-class match.
To achieve this, we developed a match simulator. This does exactly what it says on the tin. It takes the current match situation and then simulates the outcome of each remaining ball in the match using the rules of the match format to see what might happen in the rest of the game. Key to this simulation is ensuring we can accurately predict what is expected to happen for a particular delivery, given information such as the match context, batter, bowler and venue. But more on that later!
Doing one simulation of the match is not particularly interesting. Maybe we predict a hat-trick to occur and the game to be swayed towards the bowling team. Maybe not. But by simulating the game thousands of times (known as Monte Carlo simulation), we can observe thousands of potential outcomes for the match and infer likelihoods of potential outcomes directly.
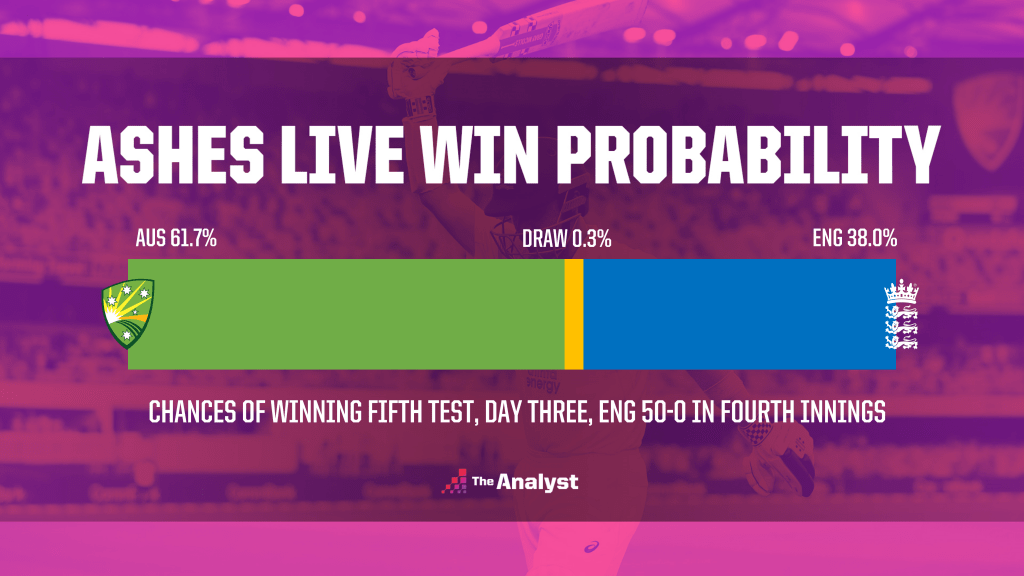
Let us go back to the fifth and final men’s Ashes Test between Australia and England in Hobart in January 2022. At 4-0 down in the series and chasing an improbable 271 in the fourth innings, England managed to reach 50-0 with Zak Crawley on 22* (33). By simulating the remainder of this Test match using our model, we can calculate how likely each result was and what were the most likely team and player scores. This gives us our live win probability and score predictions.
In this example, across 1000 simulations of the match, we had:
- England successfully chasing their target on 380 occasions, being bowled out in 617 and drawing in three of the simulations (all three were score draws since there were over two days of play remaining).
- Crawley scoring 45 runs on average.
- England’s median score at 235.
By aggregating these simulations, we predicted that England’s probability of winning at this point in the match was 38.0% (380/1000), while Australia were far more likely to win with a 61.7% likelihood. We also predicted Crawley to score 45 and England to score 235.
Sadly, for England fans, any hope was short-lived. England lost by 146 runs as they collapsed in incredible fashion to 124 all out, 115 runs short of our prediction. Meanwhile, Crawley was dismissed for 36 runs, nine runs short of our prediction.
How Do We Calculate the Next Ball Predictor?
As previously mentioned, the key to this match simulation approach is a model which can accurately predict the outcome of any delivery. To achieve this, we developed our Next Ball Predictor model, powered by Qwinn, which predicts the probabilities of various outcomes of a delivery using a multilayer feedforward neural network:
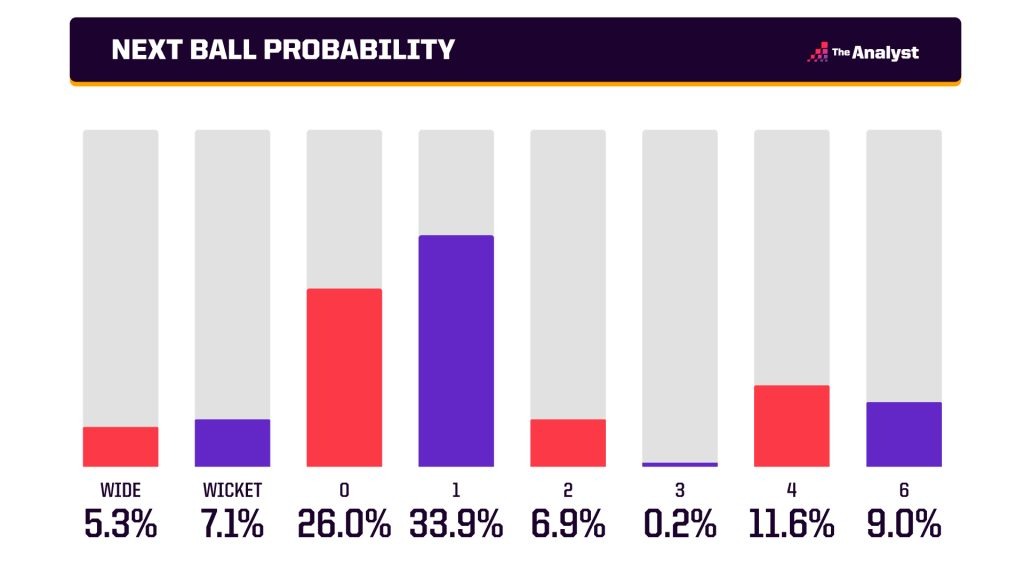
The model considers several contextual match factors, including, but not limited to:
- Home team/country
- Current match score
- Required run rate (if applicable)
- Wickets and runs per ball of the match so far
- Player and venue information
The key to the predictions is personalisation. Just because a team needs six runs to win off the last ball, does not mean the predictions should be the same for every batter, bowler, or venue combination.
The model needs to understand the ability of the players involved and the dynamics of the venue. To achieve this, we created run-scoring and wicket-rate ability metrics for all batters, bowlers and venues. These metrics can then be used to tell the model information such as how tricky we expect a venue will be to bat on, how economical we expect the bowler to be, or how quickly we believe the batter can score.
A naïve approach to this would be to look at high level metrics such as historic economy, scoring rates and batting averages. However, this does not account for the context in which the wickets or runs occurred. Scoring a century on a seaming wicket against a quality Test attack should be worth more than a century on a flat wicket against a weaker domestic side. Similarly, a maiden in the final over of a One Day match against Jos Buttler is more valuable than a maiden in the middle overs.
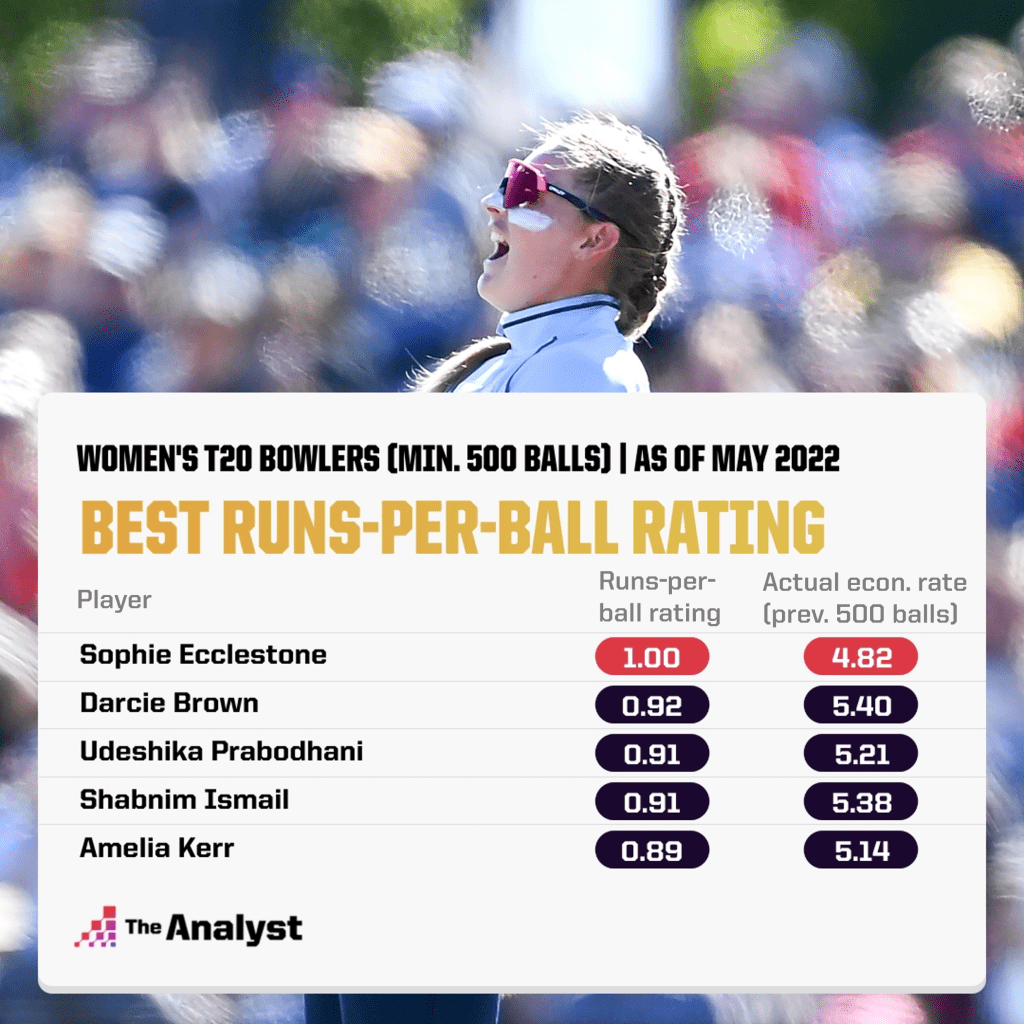
So, we developed a hierarchical Bayesian rating system which takes all our available ball-by-ball data from all international and domestic leagues and creates a standardised set of ability scores that adjusts players’ performance against their opponent’s ability and match situation. These ratings supplement other aggregated personalised information such as proportion of runs from boundaries. In total we have six personalised Bayesian metrics for each cricket format, which are standardised between 0 (worst) and 1 (best):
- Three runs-per-ball rating metrics (batter, bowler and venue)
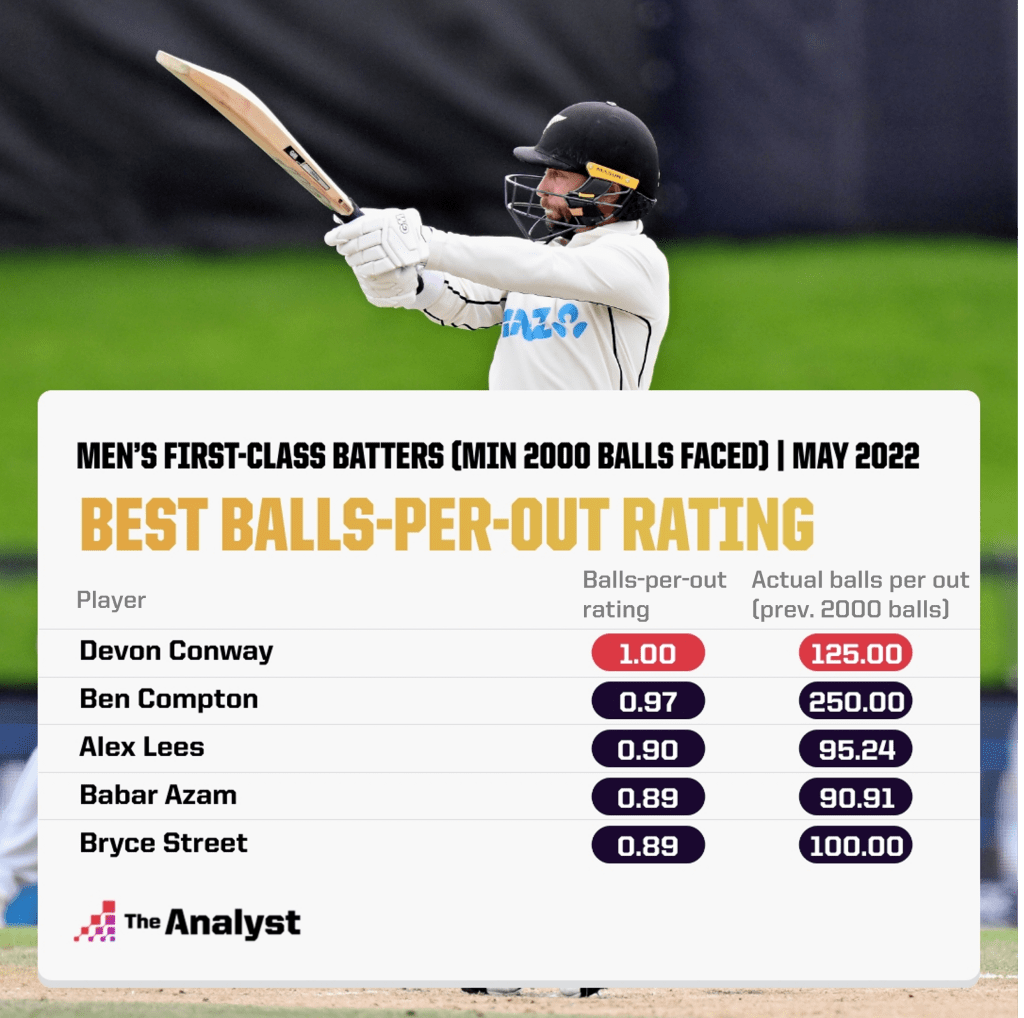
- Three balls-per-out-rating metrics (batter, bowler and venue)
Here are some of our top players for two of these ratings. Our highest-rated women’s T20 bowler (min. 500 balls bowled) in terms of economy rating is Sophie Ecclestone. Meanwhile, our hardest to dislodge men’s first-class batter (min 2000 balls faced) is Devon Conway. We also include their actual economy and out rates over their past 500 and 2000 balls respectively, showing how the rating system adjusts player rankings using match context compared to using raw values.
Cricket Simulation Models In Action
Let’s look at how we can use some of these metrics during a full game, analysing the 51st match in the 2022 Indian Premier League between the Mumbai Indians and Gujarat Titans.
Going into this game, Mumbai were all but out of contention to qualify for the play-offs, whilst Gujarat were sitting top of the league. Below we can show how our Live Win Probability outputs changed throughout this game (yellow and blue lines in the top panels), with the in-game runs scored (lines in the bottom panels) and wickets (pink dots in middle panels) used to help understand the game situation.
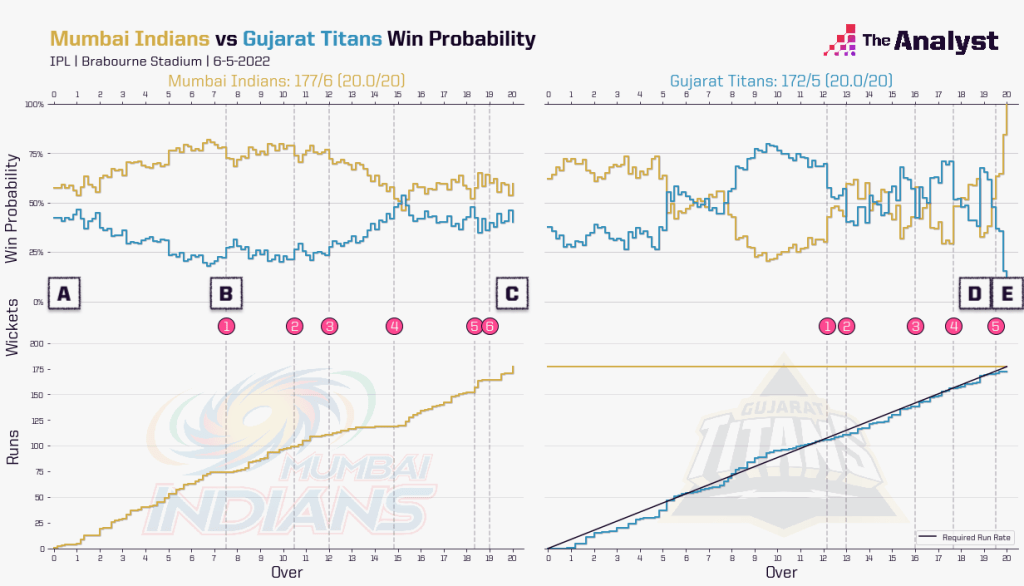
Our Live Win Probability highlights some key moments in the match, labelled as A-E above:
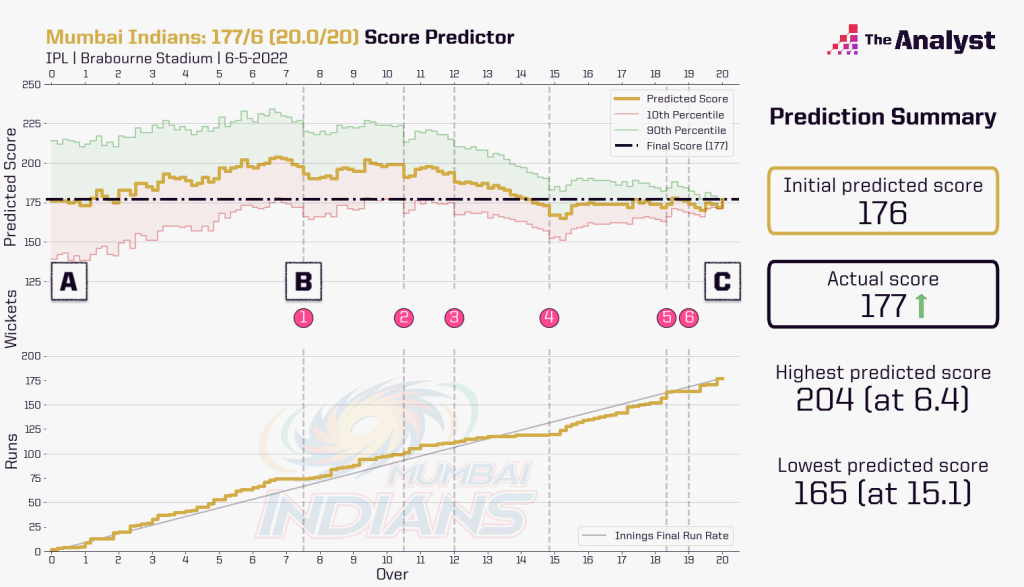
A: Even with their recent poor form, pre-game we predict Mumbai as slight favourites at 55.4% vs. Gujarat’s 44.6%. This is partially due to Mumbai’s strong line-up and their home crowd advantage. We predict Mumbai to score 176 as shown in the separate score predictor graphic below.
B: Mumbai’s explosive opening partnership saw them race to 74-1 off 7.3 overs which increased their win expectancy to 72.5%. The score predictor below shows that at this stage we predicted Mumbai to score 192 in total, with a 10% chance of scoring less than 167.
C: Gujarat fought back in the closing overs of the first innings, restricting Mumbai to 177 and reducing their win prediction back down to 59.6%.
D: The second innings sees a lot of toing and froing, with the advantage swapping an incredible 12 times going into the final eight balls, from which Gujarat require 16 runs to win. A huge moment then occurs as David Miller hits a six, reducing the target to 10 runs from seven balls. At this stage, Mumbai’s win probability drops from 62.0% to 32.5%.
E: Gujarat need nine to win off the final over. Our win predictor has Mumbai at 34.7%. However, an incredible performance from Daniel Sams successfully defends Mumbai’s total, with Gujarat falling short by five runs.
With the predictive power of our new cricket models, we are able to create live narratives about each game and determine the key moments where the odds tipped in a team’s favour. Predictions can be analysed at a macro level, such as win probability, or a micro level, such as team and player score predictions.
Enjoy this? Subscribe to our mailing list to receive exclusive weekly content.
Design by Ruben Diaz