
As someone whose turning circle and acceleration make Per Mertesacker look like a 100-metre sprinter, I can assure you that the long ball over the top for a nimble striker remains the most potent weapon in Sunday League football. Forget your false nines; playing it direct to your quickest and often best player is the way to go.
As a percentage play, going long also comes with a greater margin for error. Misplace the pass and while you’ve given the ball away, it’s probably in the opposition half and you can retain your defensive shape. The technical ball skills required to progress upfield through shorter, more intricate passing are not always easy to come by at that level, particularly on questionable playing surfaces.
Going long is safer, and probably more effective as a result.
It goes without saying that the playing styles seen up and down the country on Sunday mornings are wildly different to the ones witnessed at the professional level, despite what your cultured central midfielder or mercurial left-winger might suggest.
But even within the professional game, are there differences in styles depending on which league you’re watching? Intuitively we might think a Premier League game looks different to a League Two encounter, but is that actually true?
Well, let’s use Opta data across the last three seasons to compare.
In Possession
Let’s start with the scenario outlined in the introduction. In possession, how do teams’ playing styles generally differ as we go down the tiers in England? We say generally because there are always exceptions to the rule and there are even big differences within each league (think Manchester City and Brentford, for example).
Before we get into it, it’s worth noting that there is no ‘right’ way to play football. The beauty of this sport is beauty doesn’t matter.
The below graphic compares the averages of teams’ in-possession styles from the Premier League, Championship, League One and League Two across the last three seasons. It uses a metric called sequences, which is just a passage of play belonging to one team that ends once the ball is lost.
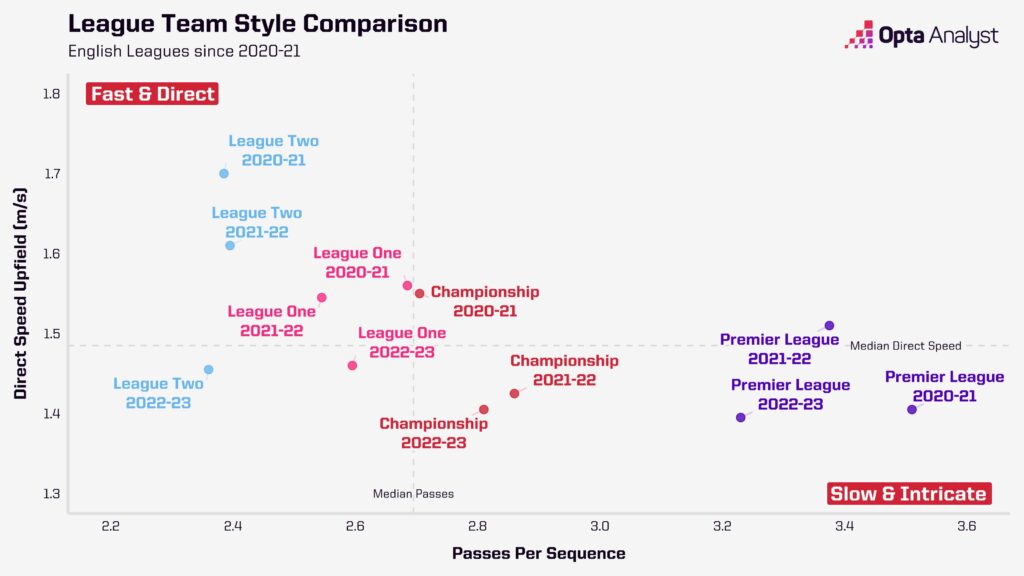
We see a clear pattern emerge. Premier League teams, on average, complete more passes per sequence before turning the ball over, Championship sides the next most and so on.
We can infer from this that Premier League sides are generally capable of holding onto possession for longer, and when we combine that with direct speed upfield – measured on the y-axis above – they are content to play slower, less direct football. Sides from the bottom of the EFL look to advance the ball upfield at a much quicker rate than those towards the top.
As mentioned, there are exceptions to these rules. This season, Nottingham Forest averaged 2.5 passes per sequence and progressed the ball upfield at 1.64 metres per second. Looking at the graphic above would tell us their style is more akin to a team playing in League Two. And if we plotted League Two Swindon Town on the graphic, their passes per sequence (3.1) and direct speed (1.3 m/s) would stick them very much in the ‘Premier League’ area of the chart.
Of course, these styles don’t exist in a vacuum. We can’t ignore the fact that Nottingham Forest and Swindon play against different calibre of opposition each week, but it is an interesting comparison, nonetheless.
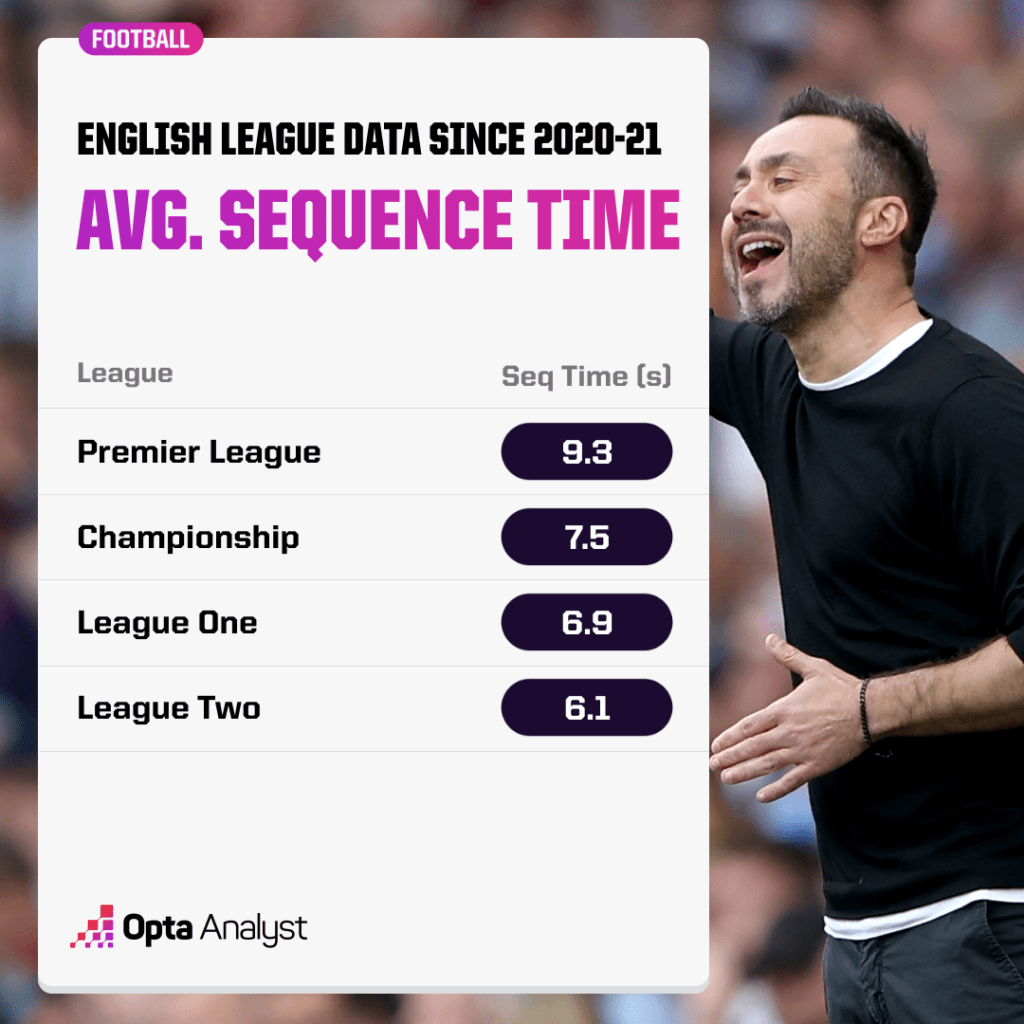
This general trend also correlates with average sequence time. Using data since 2020-21, Premier League sides hold the ball for an average of just over nine seconds per sequence. That figure decreases as we journey down the tiers.
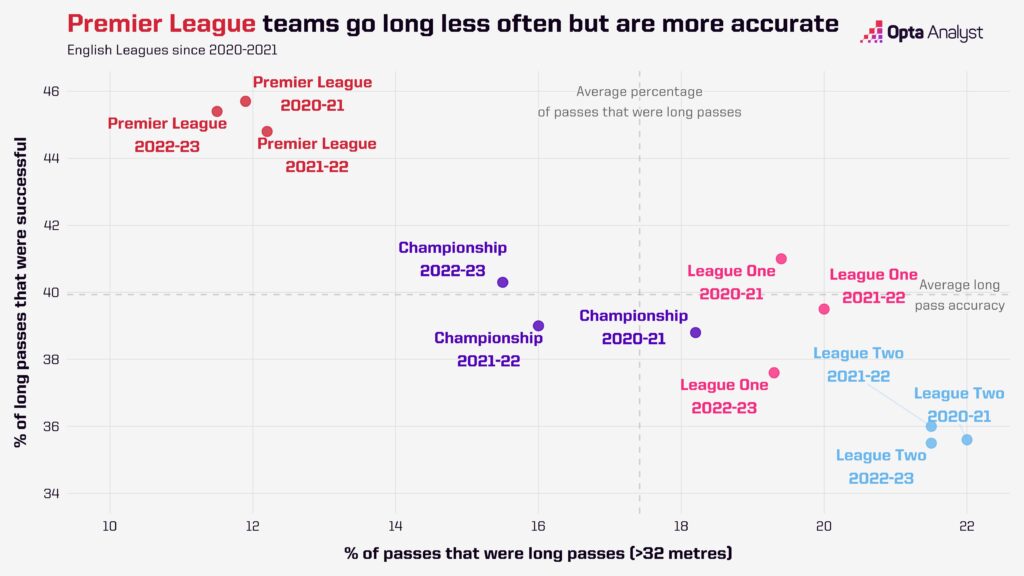
Moving away from sequences and just looking at passing tendencies solidifies this pattern. Generally speaking, a higher proportion of passes are hit long as we go down the tiers and the accuracy of these long passes falls consistently.
And overall passing accuracy strongly decreases as we go down.
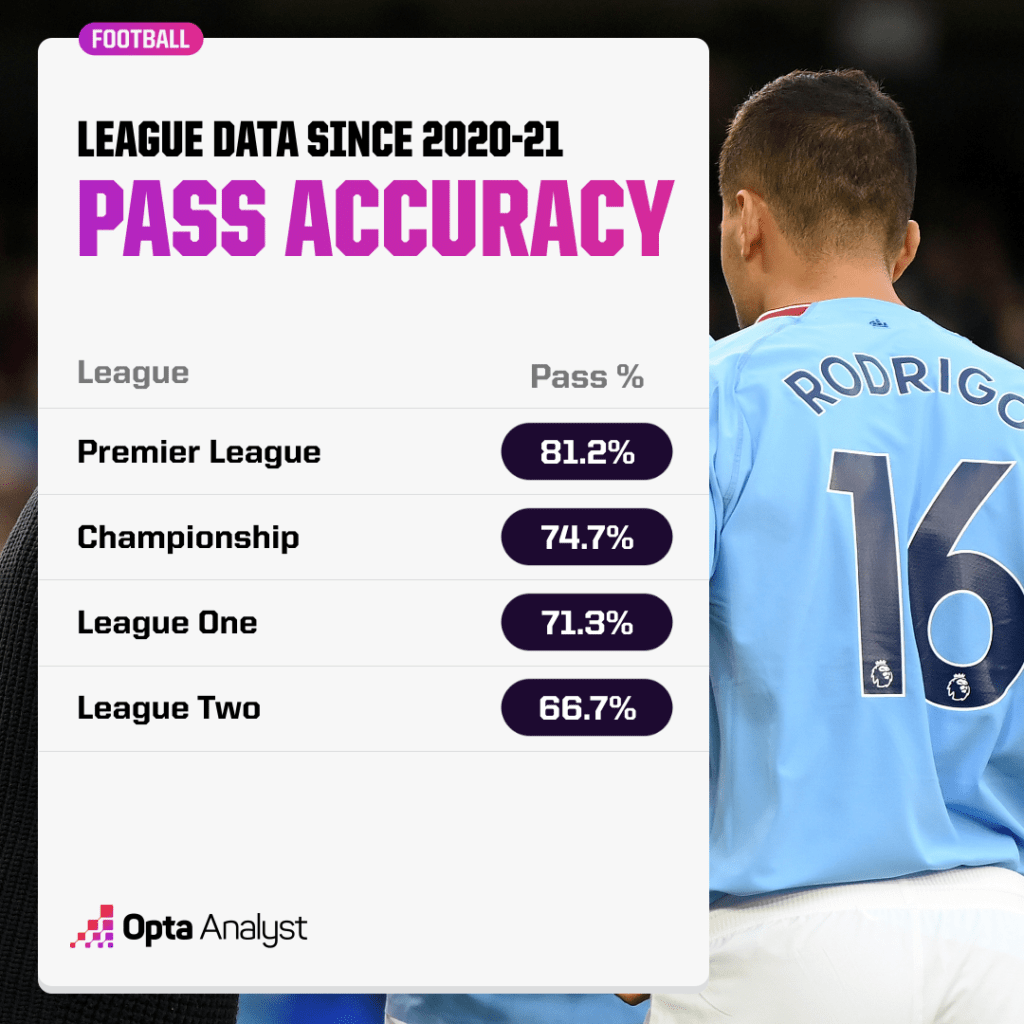
Again, none of this is to say that low passing accuracy is inherently a bad thing, or that playing long passes is an unsuccessful strategy. Norwich City have notably tried and failed to implement their passing style in the Premier League. On the flip side, Brentford finished 2022-23 with a passing accuracy of 74.8%, way below the Premier League average. And what happened? They achieved a top-half finish.
Not All 90 Minutes Are Equal
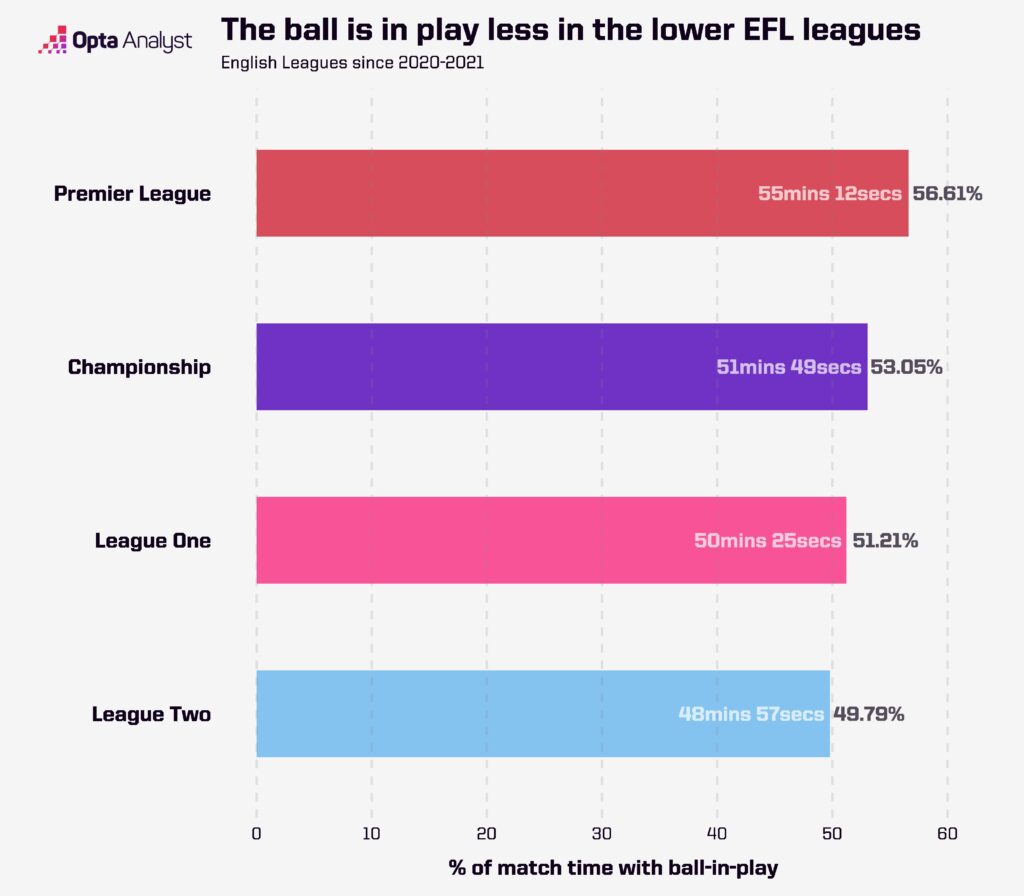
It may sound strange at first, but there’s actually a pretty big difference in how much actual football you get to see when watching a game depending on what level you watch.
The ball was in play for 56.6% of all Premier League matches this season. If that sounds low, then, yikes, because that’s the highest mark we get to in this study. That ball-in-play percentage falls consistently as we go down the different tiers, to the point where in over half of matches in League Two, football is not being played.
The total difference between the Premier League and League Two is about a six-minute swing on average per match.
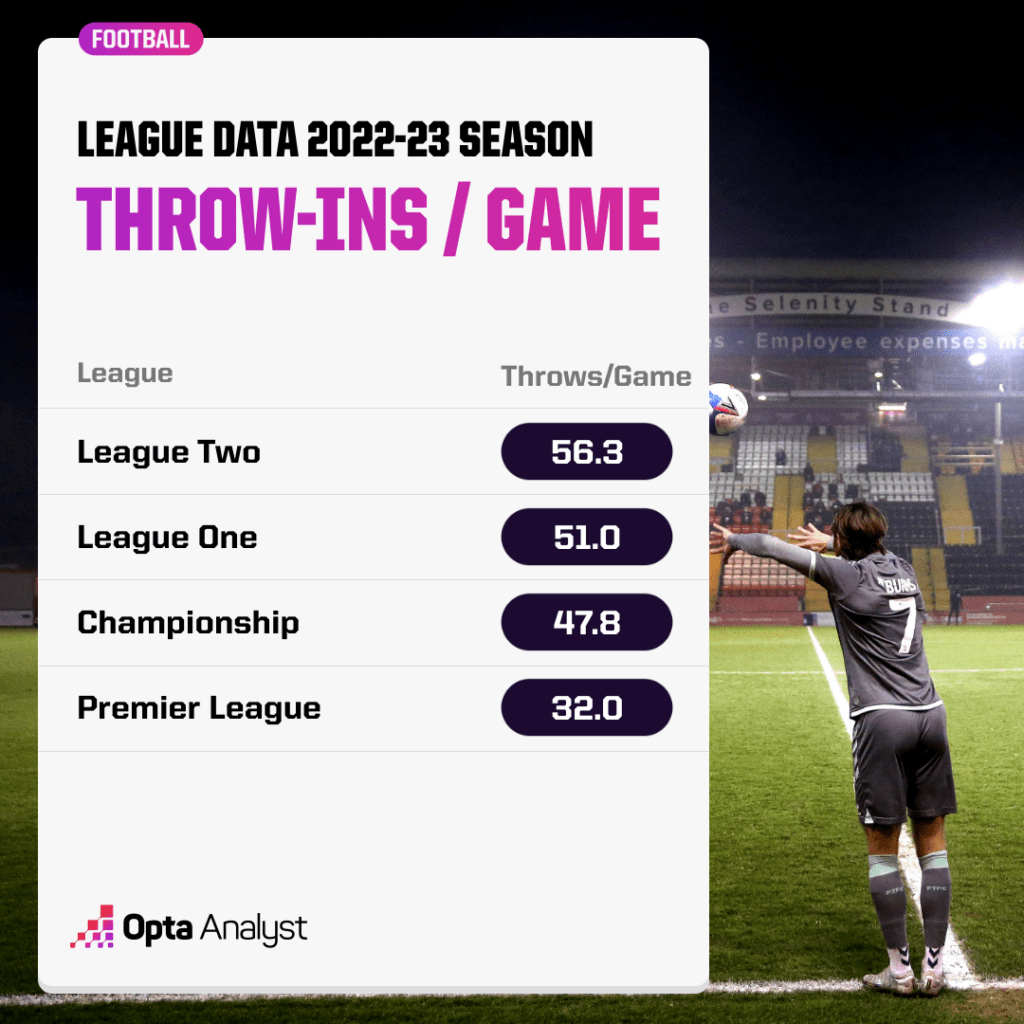
Although there are undoubtedly other, more nuanced, factors at play, one of the biggest time-drainers in lower-league football is the insane number of throw-ins, presumably from overhit long balls that dribble out of play.
In the 2022-23 season, League Two games are averaging over 56 throw-ins per game, compared to just over 30 at the top level. All that umm-ing and ahh-ing about where to throw the ball before eventually deciding that launching it down the line is the best way to go takes up valuable time when aggregated.
Attacking Outputs
Enough about how teams try to score goals, let’s look at whether they actually do.
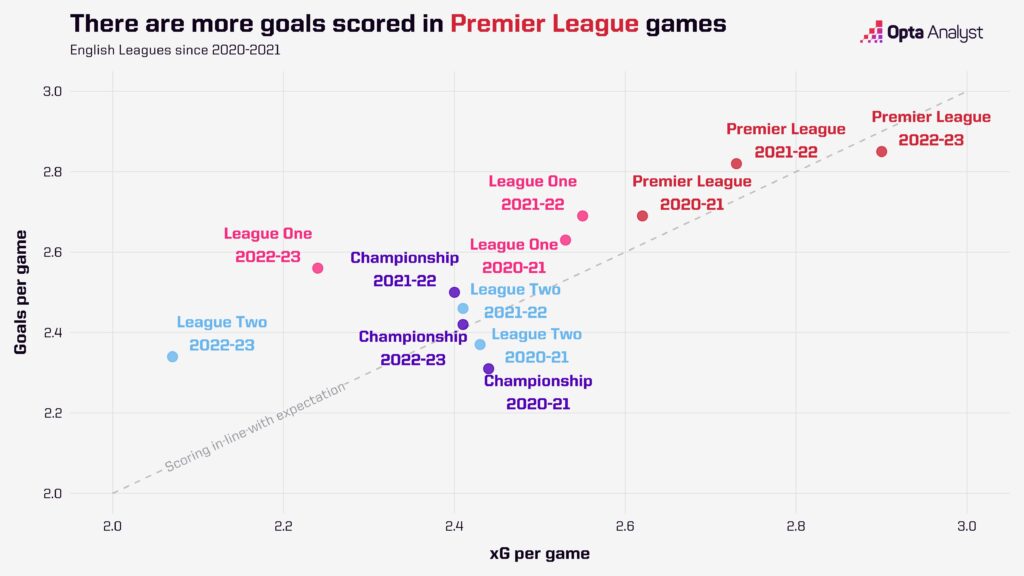
If you want your action laced with goals, the Premier League is the place to go. Since 2020-21, the top flight has seen more goals per game than any others in the English Football League. But the journey down the leagues is not as linear as with playing styles. League One (2.63) has been home to more goals per game than the Championship (2.41) over this time period, with League Two (2.39) closely behind.
But goals can be noisy and subject to swings in finishing. Expected goals (xG) per game gives us a better indication of the underlying chance quality and tells us how many goals per game we should expect to see.
Again, the story is similar for the Premier League, we see healthy numbers of expected goals as well as real ones.
But outside the Premier League, there’s less of a pattern, with League One being more goal-laden than the Championship in recent years.
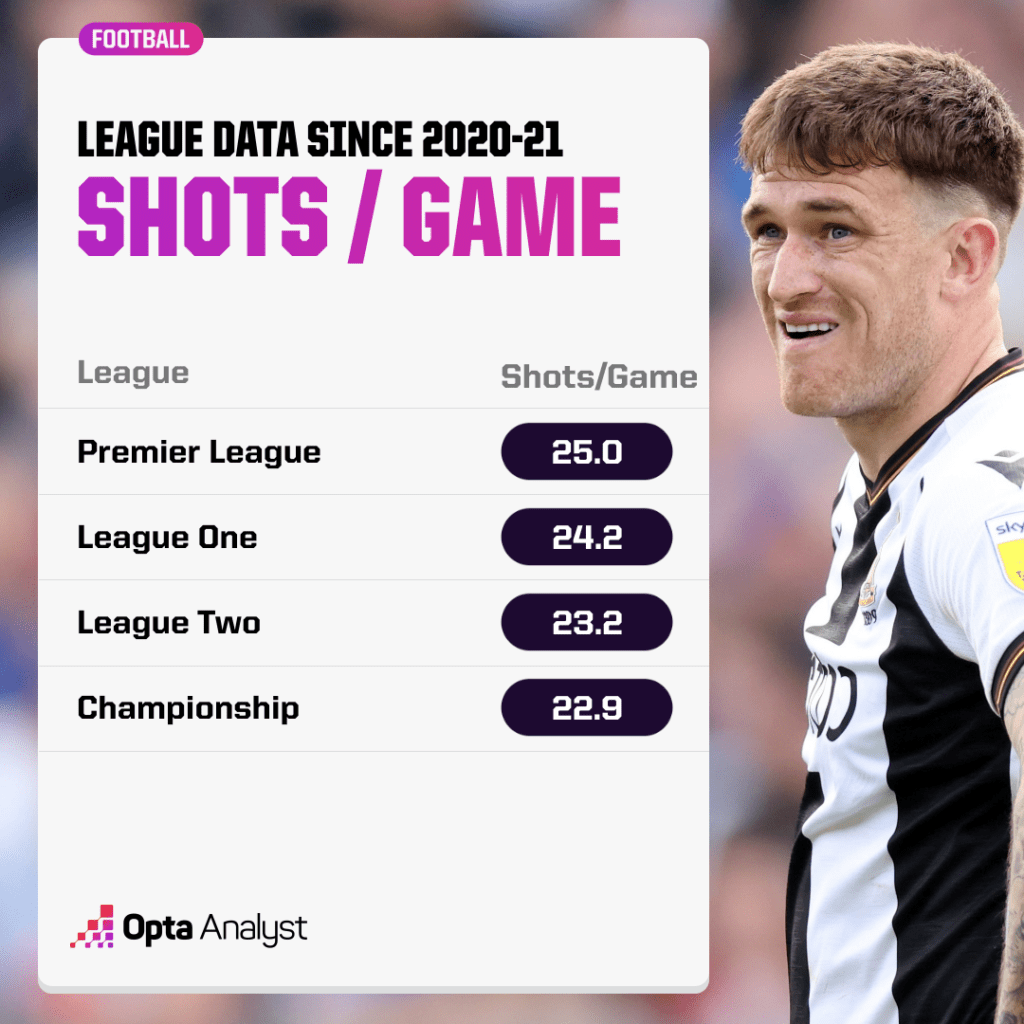
How does that translate to shots?
The Premier League has averaged more shots per game than the other three leagues in this time frame (25.0), but both League One and League Two average more than the Championship.
Differences in Shooting Tendencies
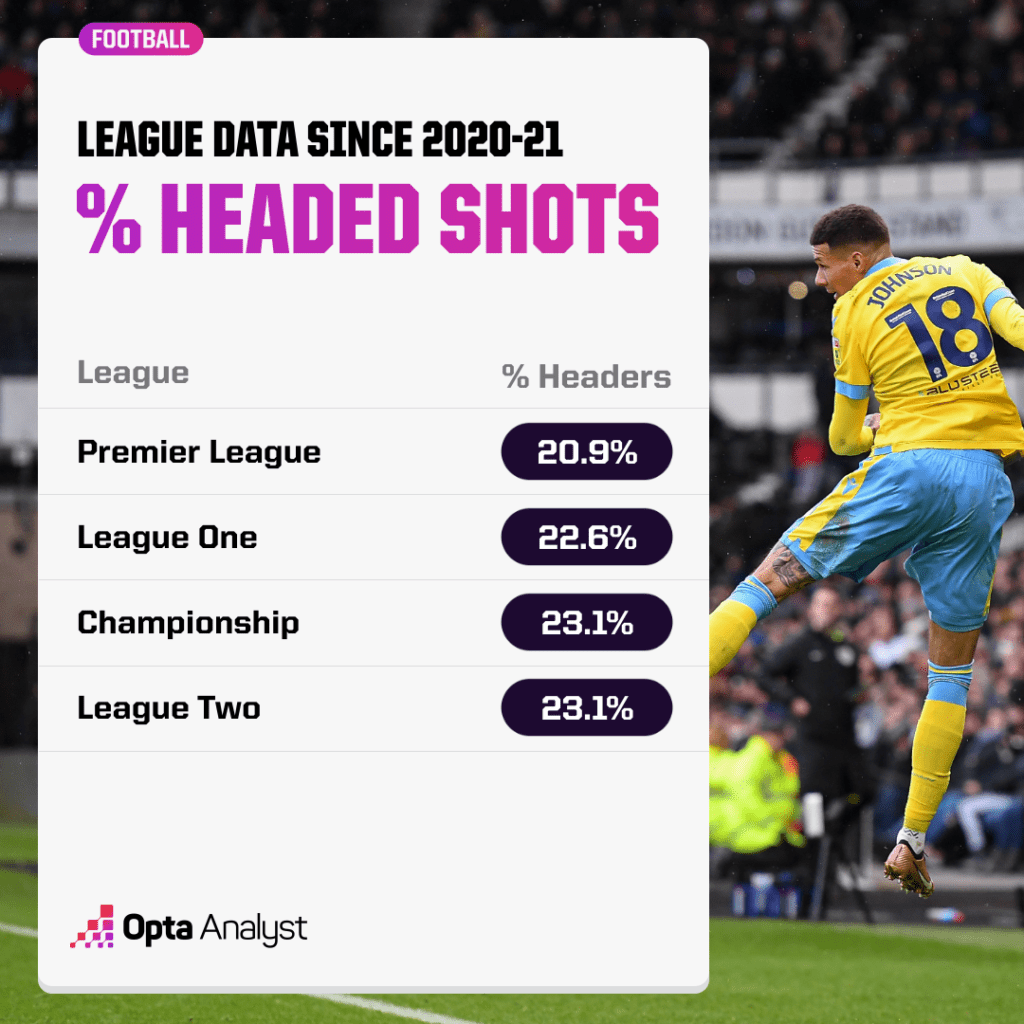
Given the ball is in the air for longer periods of time in League One and League Two, the first natural place to look is at headers, which are typically more difficult chances to score. Are these teams more reliant on the aerial route as a way to create chances?
Sure enough, headed shots in the Premier League make up a far lower proportion of total shots than in the Championship, League One and League Two, with an average across these seasons of 20.9%. But the distinction between the tiers becomes blurrier as we work down, with the three tiers below all roughly averaging the same proportion of headed attempts on goal.
Set pieces play a big role in this ‘Premier League vs. The Rest’ split, too. Shots from set plays – either a direct attempt at goal or via a corner or free kick – account for just 6.5% of all shots in the Premier League, but account for almost 8% of chances in the lower three tiers.
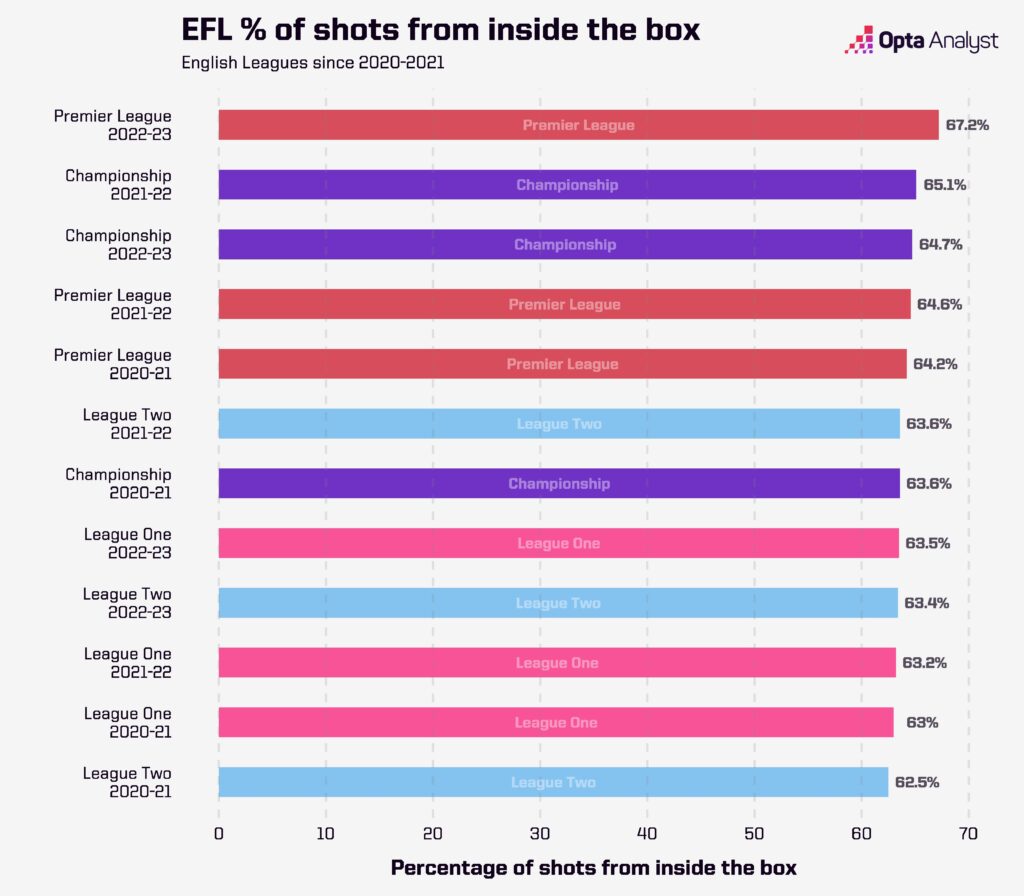
But the biggest difference – and the one that is likely contributing to seeing more goals go in – is shot location. The best sides in England are the best at working the ball into dangerous situations closer to the goal, where chances are more easily converted.
Since 2020-21, 65.3% of all shots in the Premier League have been taken inside the box. That drops consistently in each tier as we go down: Championship (64.4%), League One (63.2%) and League Two (62.1%).
And average shot distance in matches gets further and further out as we drop down the pyramid:
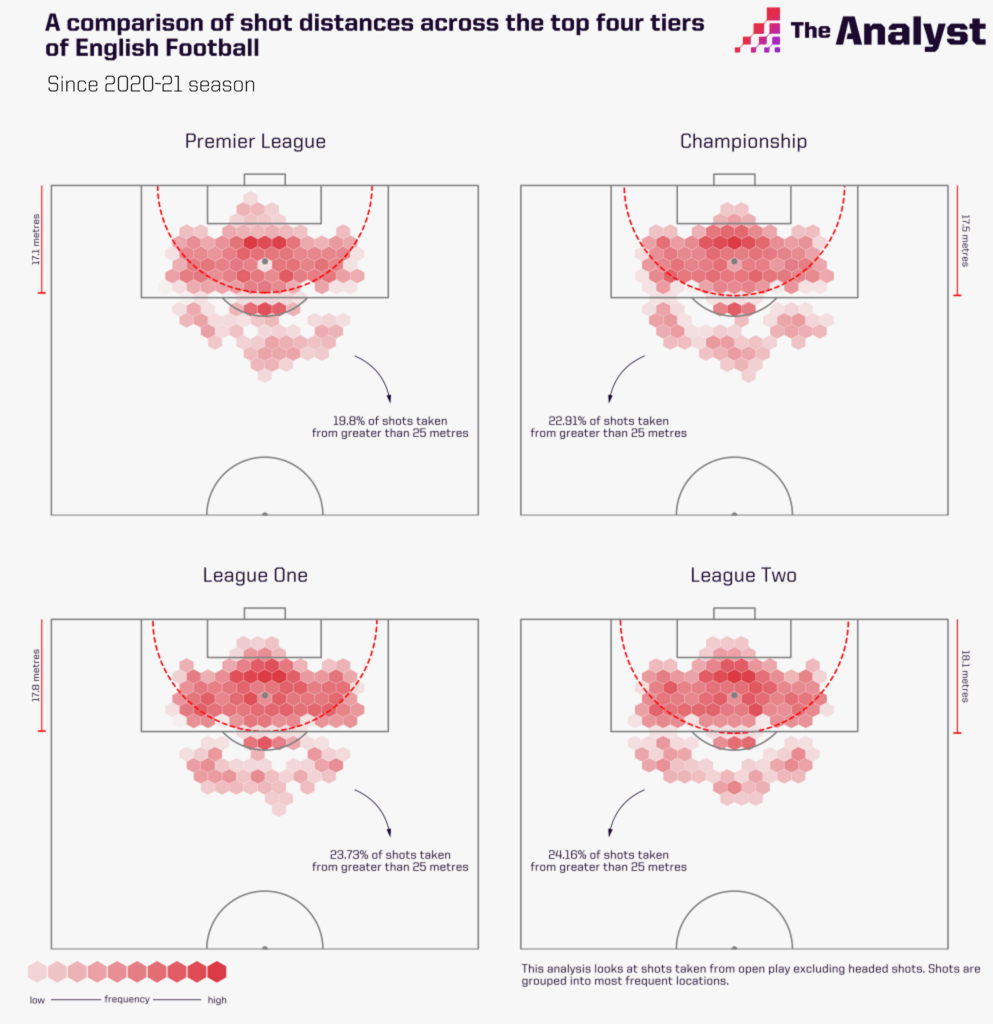
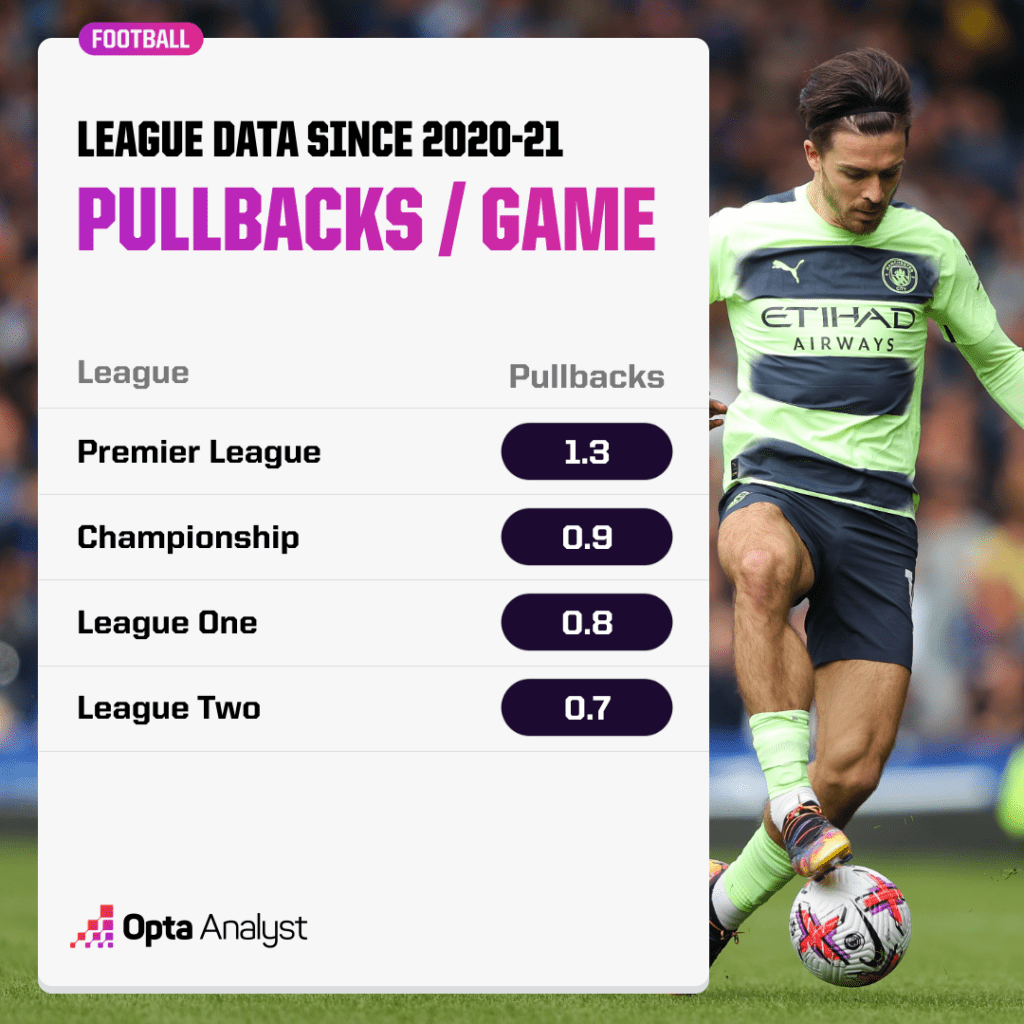
There are plenty of explanations for why that is the case. But one interesting observation has been the rise in the popularity of the cut-back cross, particularly in the top flight. You know the one, the Pep Guardiola hallmark. The move with the passes and then the cut-back and the far-post tap-in; the one that Manchester City score without thinking. These passes can be so effective because it leaves the shooter with a close-range attempt at goal, often with a goalkeeper out of position.
Well, those pullback passes per game are at their highest in the Premier League, with the likes of Manchester City, Chelsea, Brighton and Liverpool among the highest exponents. The frequency of these by-line cutbacks reduces as we journey down.
All of these factors – shooting from closer range, receiving ‘better’ passes to shoot from, relying less on set pieces to generate chances and taking fewer headed shots – result in much better chances.
And as the below chart demonstrates, shot conversion rates are at their highest in the Premier League, although kudos to Burton Albion’s Kane Hemmings (15 goals) and Gillingham’s Jordan Graham (12 goals) who both eclipsed a 30% conversion rate in 2020-21, undoubtedly pulling that League One season’s average up.
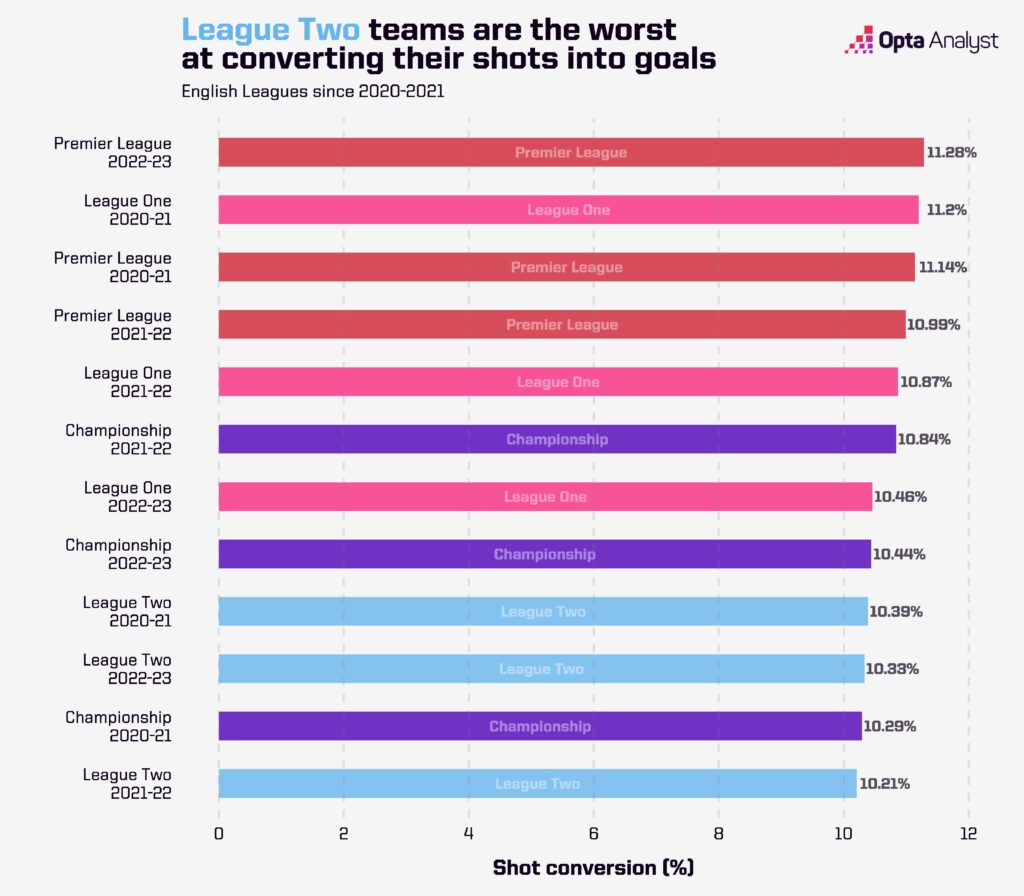
And better shot conversion leads to, you guessed it, more goals.
Defending
Lastly, how about major differences when teams haven’t got the ball?
The influence of foreign coaches on the English game is well-documented, with the likes of Pep Guardiola, Jürgen Klopp, Roberto De Zerbi and Mauricio Pochettino among plenty of others placing a heavy emphasis on high-pressing styles when out of possession.
And successfully winning the ball back close to the opposition goal does occur more frequently in the top tier, with that number reducing steadily as we drop down the leagues.
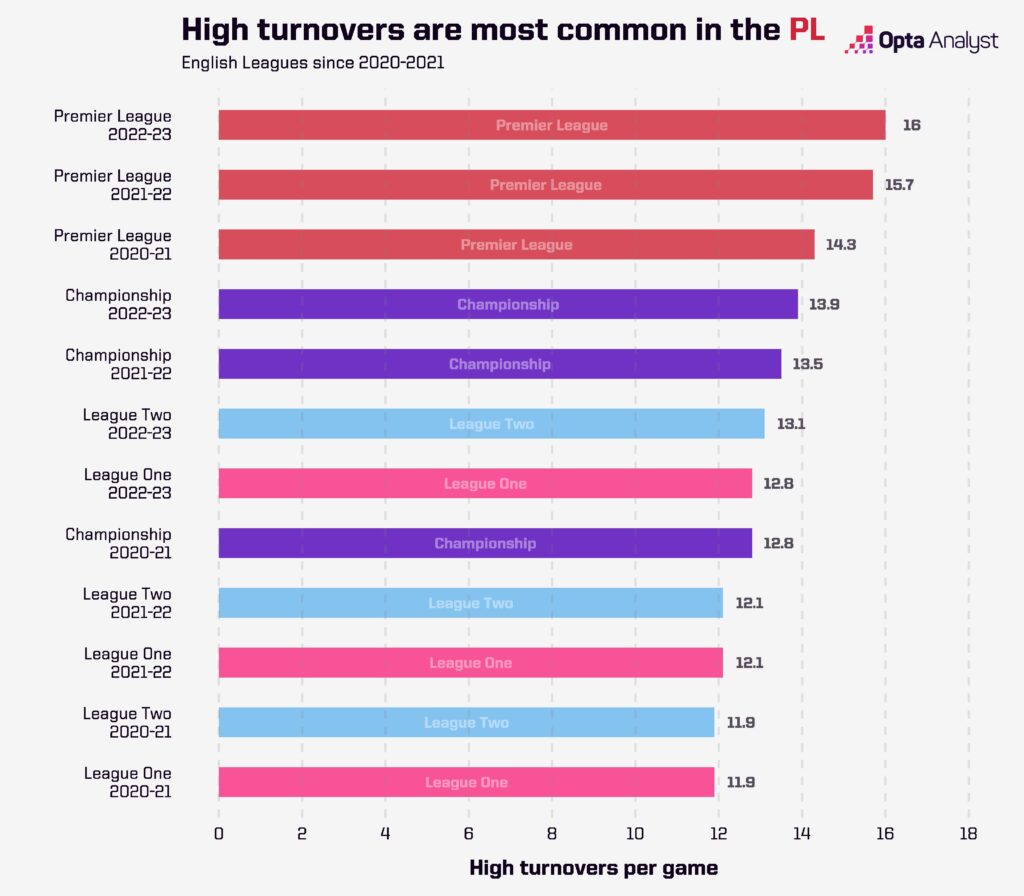
Again, this is not to say that teams do not employ pressing styles in lower leagues. Both Grimsby Town and Mansfield Town (of League Two) had a PPDA – the number of passes they allow their opponents to complete before making a challenge – of 9.8, lower than any Premier League side in 2022-23. It’s just that on average, more of these turnovers happen per game the higher up you go. As does the number of shot-ending turnovers too.
Pundits talk broadly about “being punished” at the top level. One mistake in possession, we’re often told, is all that needs to happen for the opposition to pounce and score.
One rudimentary way we can proxy “ruthlessness” is to look at the proportion of total shots that come directly as a result of an error.
There’s a pretty strong correlation between the quality of the league and its ruthlessness. Since 2020-21, 3.0% of all shots in the Premier League have come directly from errors, with that figure falling in each descending league. Given we’re talking about top-flight defenders here, you’d like to think that’s because opposition attackers are betting at punishing mistakes, rather than defenders making more mistakes…
It also points to lower-league defenders going long under pressure rather than trying to play through an opposition press.
So, onto our takeaways. Longer, more direct styles of play down in League Two. A bigger onus on set pieces in leagues outside the Premier League as a direct way to generate chances. More goals and higher shot conversion rates in the top flight, together with a bigger emphasis on high pressing out of possession.
Plenty of those feel intuitive, but it’s nice to see the numbers backing up the hunches.
You see less of the action the lower down the leagues you go, but given the astronomical ticket prices in the Premier League, you probably still get more bang for your buck.
One thing’s for certain: League Two full-backs must be really good at throw-ins, they get enough practice.
Enjoy this? Subscribe to our newsletter to receive exclusive content.