Through the application of tracking data, Stats Perform’s AI-derived Shape Analysis model is changing the way we identify a team’s shape, in and out of possession, during a game.
Formations are concepts that every football fan understands and are a common topic of discussion, whether it’s a classic 4-4-2, a possession-dominant 4-2-3-1 or the ever popular variations of three at the back. But does that really tell us the full story of how your team lines up? Is Pep Guardiola’s 4-3-3 the same as Jürgen Klopp’s 4-3-3?
Sky Sports pundit Jamie Carragher recently spoke on Sky Sports’ Monday Night Football about the need to look at formations in and out of possession and the manual process undertaken to recognise these distinctions.
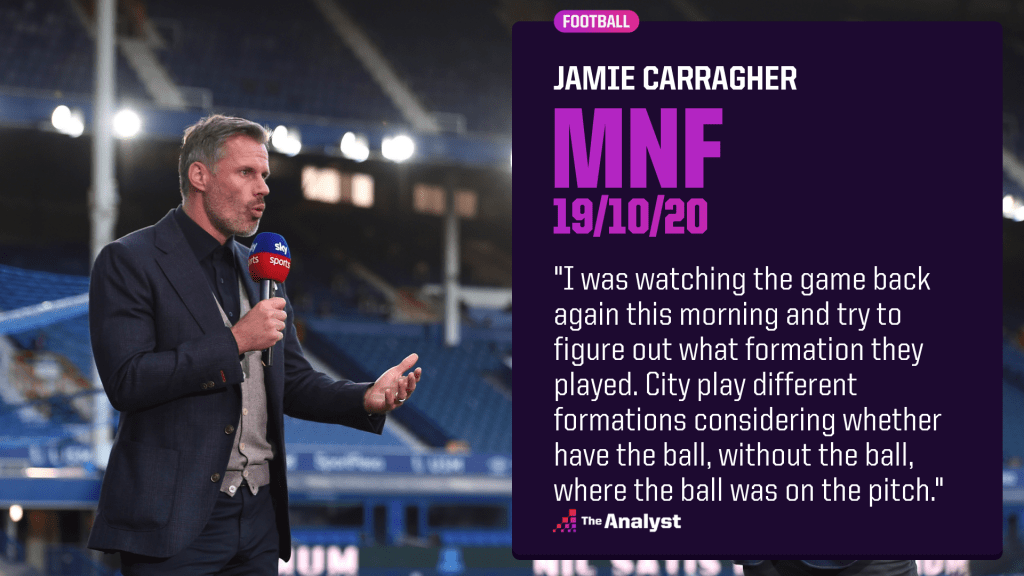
The problem is that formation analysis is still a subjective and time-consuming task, with experts like Carragher having to spend their mornings going back through video to figure this out. That is, until now…
With Stats Perform’s proprietary Shape Analysis, we’re able to use tracking data and the latest machine learning techniques to dive into the finer details of what a team’s shape really looks like, both in and out of possession, and iron out some of the weaknesses of more traditional measures such as starting formations and average positions. We can save Jamie the task on a Monday morning.
What is Shape Analysis?
Tracking data from team sports is inherently unordered as players constantly move around the pitch. Stats Perform’s Shape Analysis model uncovers the strategy behind this movement by considering how players are positioned relative to each other at any given moment in the game. By differentiating between when a team is playing in possession or out of possession, it allows us to distinguish between their attacking and defending shapes.
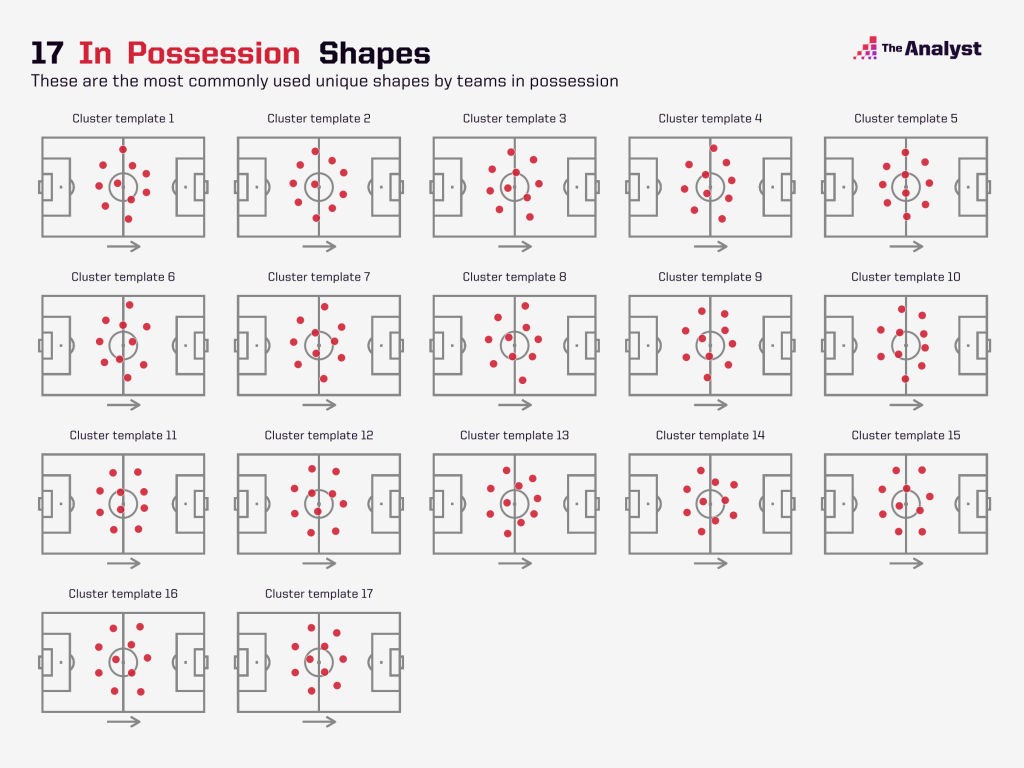
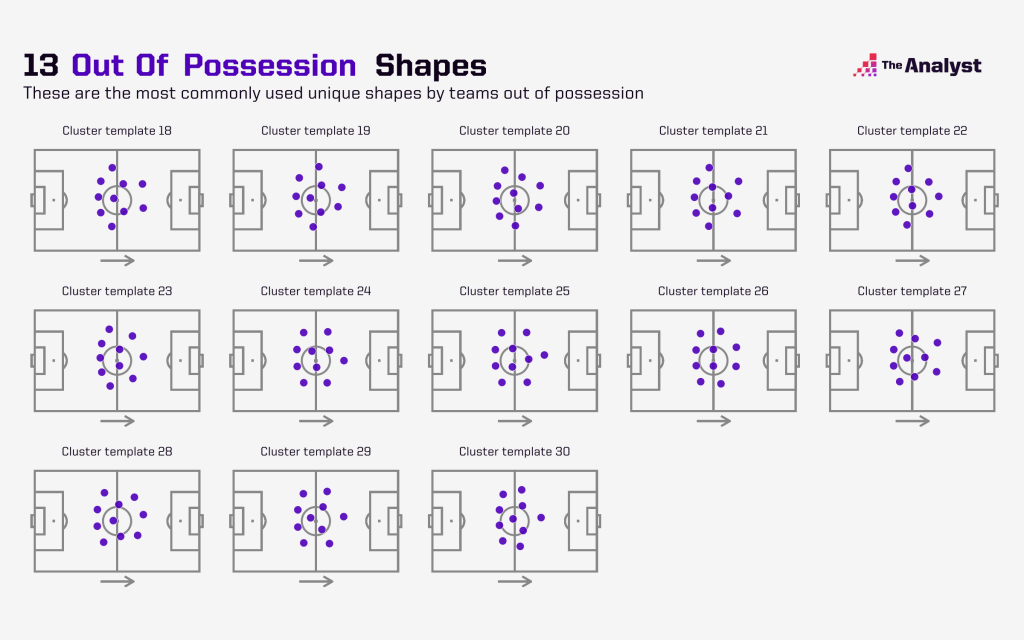
In order to match these relationships to known shapes used in football, we used hierarchical clustering from over 2,000 games of tracking data to identify 17 distinct shapes when a team is in possession, and 13 distinct shapes when a team is out of possession. Using this data-first approach, we aren’t biased by the traditional formations labels and we can identify the shapes most commonly used by teams.
To detect a team’s shape (and changes in shape) within a game, we follow a three-step approach:
- Divide the game into distinct intervals when a team is playing in or out of possession.
- Within these intervals, we use an unsupervised machine learning technique to identify a shape for the team in and out of possession, respectively.
- Assign the most likely shape from our templates (17 in possession and 13 out of possession) to the shape recognised within the interval.
The distinct intervals of possession are naturally broken up by stoppages in play (e.g., substitutions, goals and red cards) or turnovers as these are prime candidates for coaches to change tactics. Each interval must contain a minimum amount of ball in-play time in possession in order to allow for sufficient data.
Applications: Chelsea vs Wolves
Let’s look at the traditional ways of measuring team structure and then see how Shape Analysis tells the story during Thomas Tuchel’s first Premier League game in charge against Wolverhampton Wanderers.
Starting line-up graphic
The most common depiction of a team’s shape is the starting formation or line-up graphic, typically seen in post-match reports or one hour prior to kick-off with the release of the team news (as avid Fantasy Premier League users know all too well). These formations have to be manually assigned or anticipated by an analyst watching the game because, unsurprisingly, managers are rarely forthcoming nor required to release tactical insights like this.
So how did Thomas Tuchel set up in his first match in charge? He surprised many by shifting from Frank Lampard’s favoured back four to a “Conte-era” style back three, starting with a 3-4-3 formation and utilising Ben Chilwell and Callum Hudson-Odoi as his wing backs:
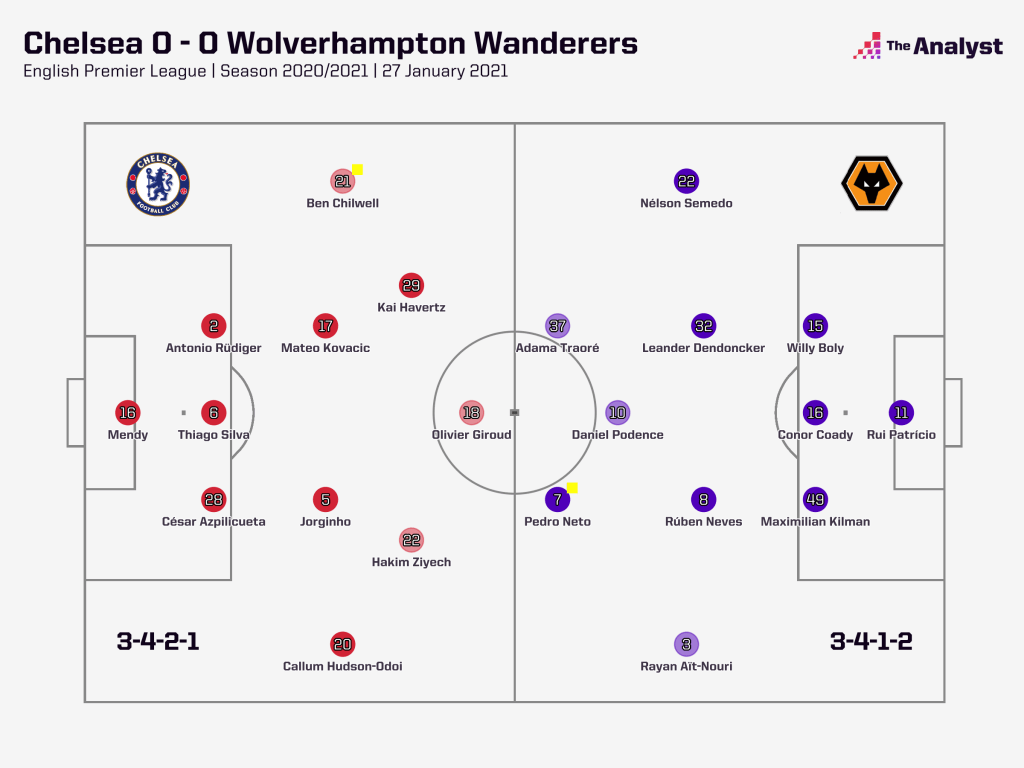
Line up graphics like this are a very static representation of a team’s shape and anyone who’s watched a Pep Guardiola team during the last few years knows that these formations can be far more fluid in reality. These formations struggle to bring out the nuances of a team’s true shape during the game and can be biased by the assigning of traditional player positions. Will Callum Hudson-Odoi play the same wing back role as Ben Chilwell?
Average positions
That is where average position graphics come in handy. Automated by data, these are commonly used by broadcasters and give us additional insight into the positions that players had within these formations. Chelsea’s average positions against Wolves suggest that Hudson-Odoi was the far more advanced wing back and that the two forwards either side of Olivier Giroud played very narrow.
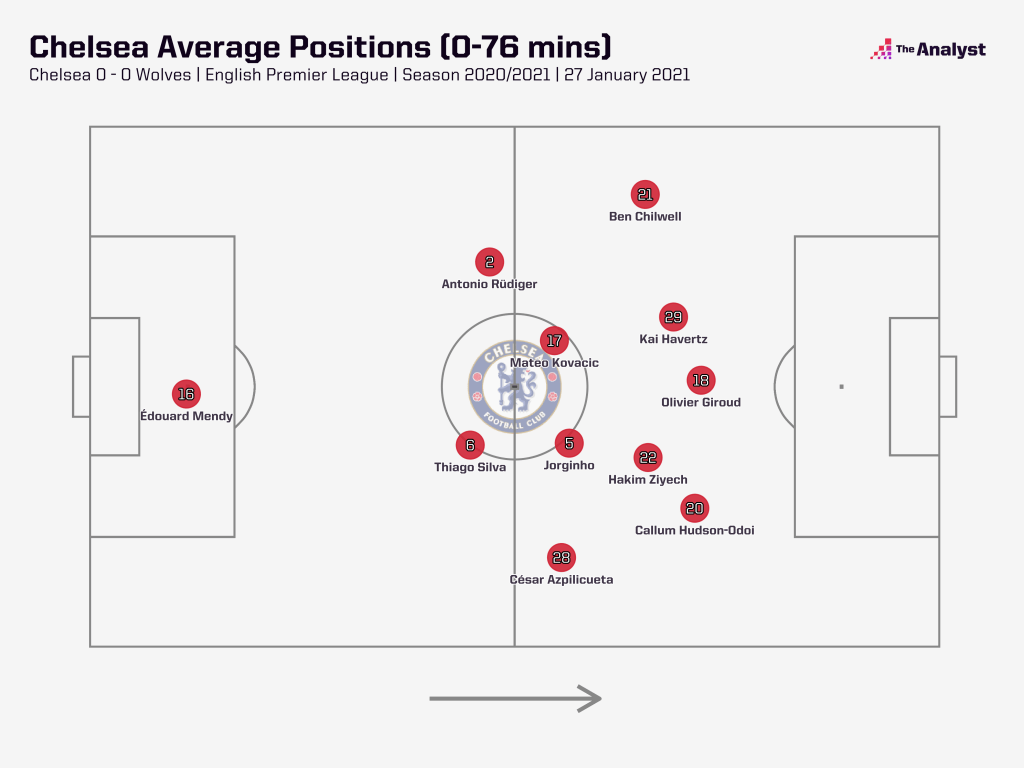
Contrary to what most people expect, average position graphics are typically based on the average location of a player’s touches rather than the physical locations of the players (we’ll save ruining what ‘touches’ are for another time). Of course, when available, tracking data can be used in these average position graphics to more accurately portray player positions, but both methods still come with their limitations:
- How do you accurately distinguish the positions between in possession and out of possession?
- What happens if a player’s position changes during the game (e.g., the wingers swap sides)?
- What happens if a team changed formation during the game?
- How do we accurately show the locations of substitutes coming on late in the game?
While using tracking data-based approach can alleviate the in and out of possession problem, you can still see how some of the above issues are evident when we focus on Wolves’ average positions:
While the formation looks mostly as expected from the line-up graphic (3-4-1-2), the three Wolves forwards’ average positions all appear to be in the same place, particularly when out of possession. We know that this can’t be an accurate representation of Wolves’ true shape during the game.
Applying Shape Analysis
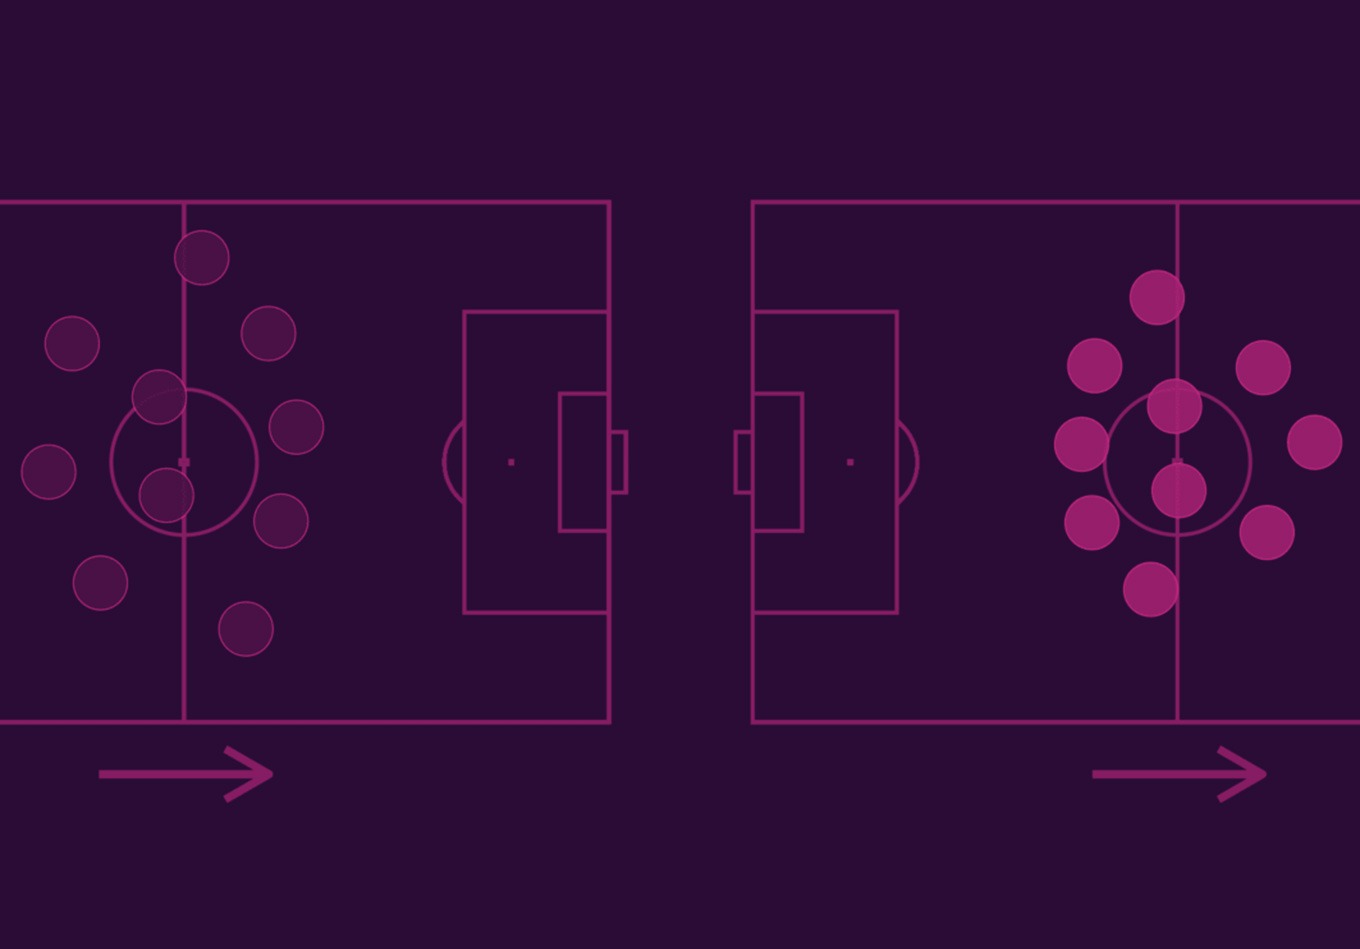
Using the Shape Analysis outputs for Chelsea vs Wolves, we can now clearly identify the shapes, both in and out of possession, that each team were using most frequently during the game:
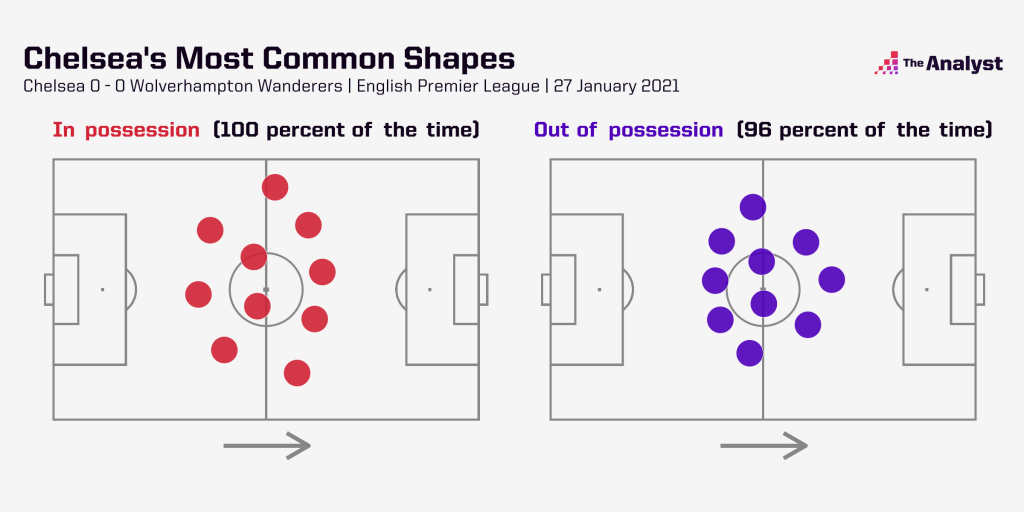
For Chelsea, we can see that their wing backs push much further forward while the team is in possession and that the wide forwards remain fairly narrow.
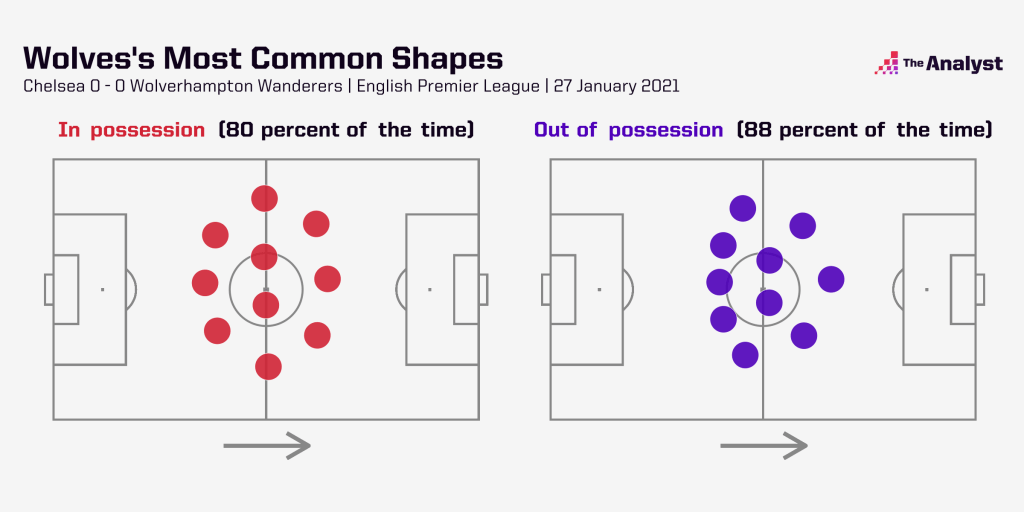
While these are similar insights to those that we found by using the average positions, we can now also understand the locations of the three Wolves forwards more accurately by assigning the locations of each player within the identified shapes.
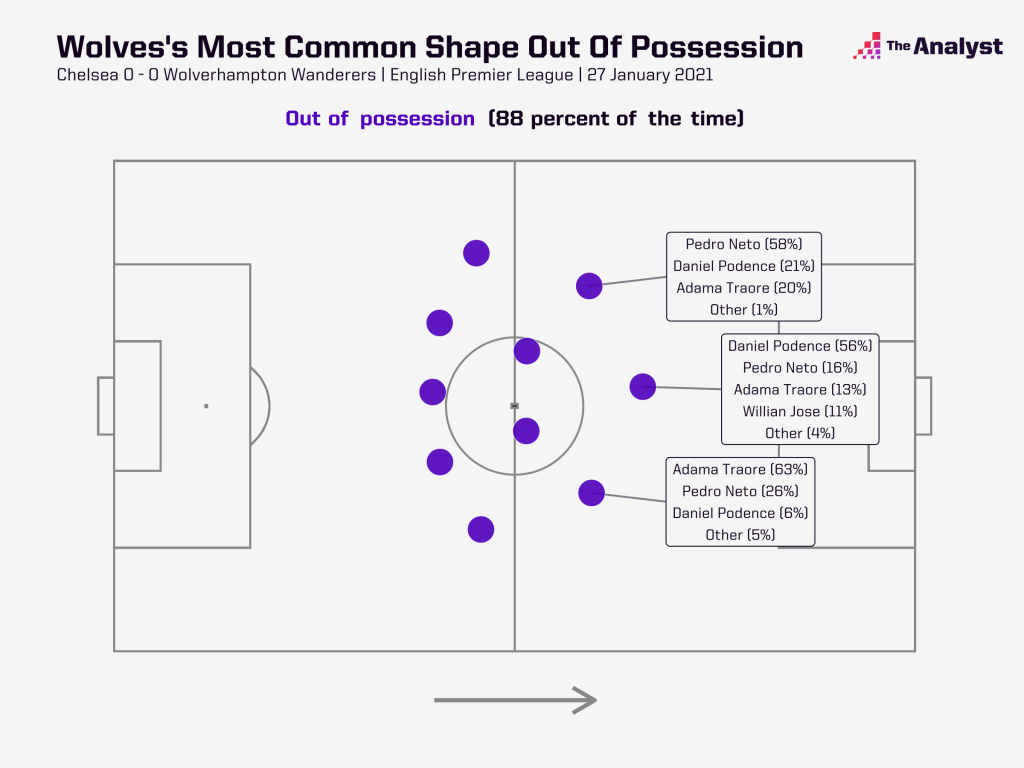
With Shape Analysis, we can see that the average positions were misleading for Wolverhampton’s three forwards because they were rotating during the game. While this may seem obvious, we can now quantify this. Daniel Podence occupied the most central of the forward positions in this shape 56% of the time, but both Pedro Neto and Adama Traore also featured there during the game (16% and 13% of the time respectively).
The Shape Analysis framework also incorporates substitutes too, recognising that Willian José (who came on in the 72nd minute) played 11% of the total minutes in this central position.
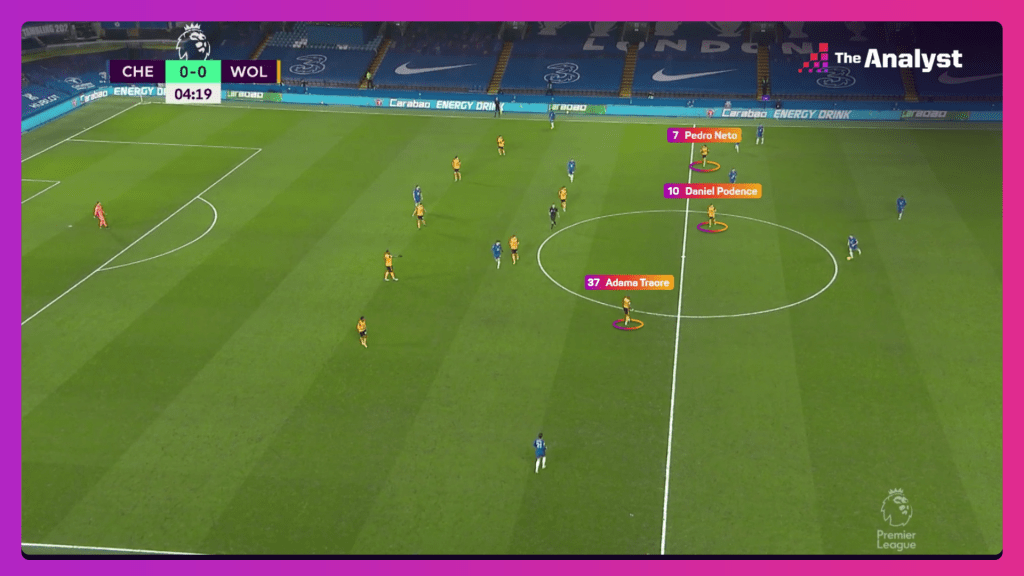
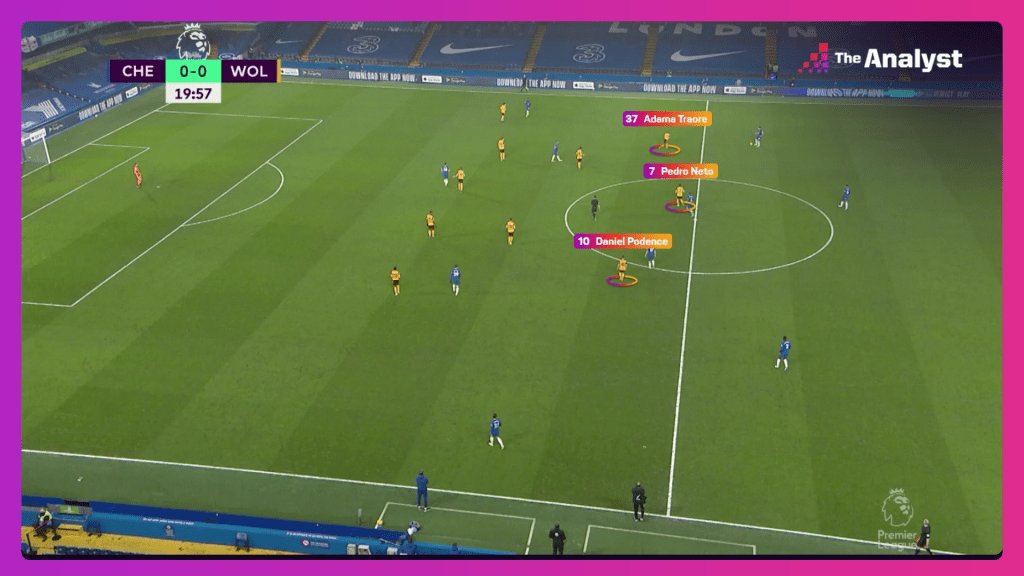
This is confirmed in the screenshots below as you can clearly see that the Wolves forwards were in their expected positions in the fifth minute but, fifteen minutes later, had swapped. This was a common occurrence during this game.
On top of detecting the most commonly used shape by a team, by applying the model to different time intervals, it can also allow us to detect when a team changes their shape during the game. This is currently only possible when manually recorded by an analyst in game, but it is an important tactical shift to recognise in analysis.
Scaling Shape Analysis
With this data-led approach, Shape Analysis has a number of scalable applications which can save huge amounts of time for analysts in the industry and improve story-telling capabilities to engage fans:
- What does Chelsea’s shape look like during Thomas Tuchel’s first 10 matches in charge?
- How did Brendan Rodgers change Leicester’s shape to mastermind their victory against Liverpool?
- How often does Arsenal’s Bukayo Saka rotate positions during a match?
- Which shape do Pep Guardiola’s Manchester City use in and out of possession?
- Which has been Manchester United’s most effective goalscoring shape?
Shape Analysis automatically identifies the shape of a team (and changes of shape) within a single game that can be applied across multiple games to provide actionable insights. Formations are the first building blocks, but shapes assemble a more descriptive story.