
The Premier League is seeing more goals than ever, but why is this happening? Great finishing? Poor goalkeeping? Increased match time? We look at the numbers.
The Premier League prides itself on being the ‘most exciting league in the world’, which obviously depends on what excites you when it comes to football.
If that thing is goals, then you should be in your absolute element watching England’s top flight this season.
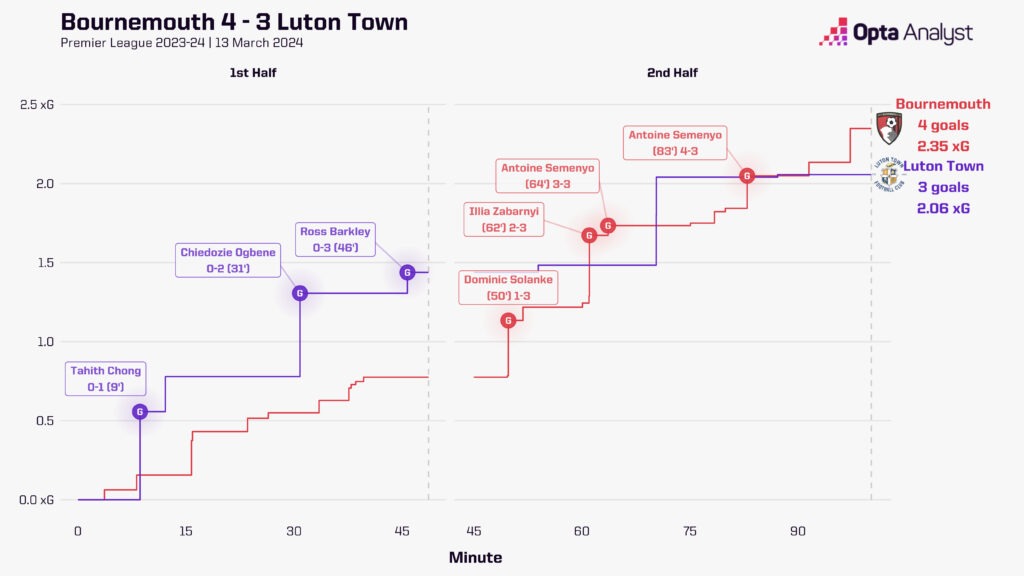
With all due respect, the recent game between Bournemouth and Luton Town earlier this month was hardly anticipated as much as the UEFA Champions League knockout stage, which was taking place on the same night, but it perfectly encapsulated the unpredictability of the Premier League in 2023-24.
Andoni Iraola’s side became just the third team in the league’s history to come from three goals down at half-time to win a seven-goal thriller, leaving those who had chosen to watch the very exciting encounters between Atlético Madrid and Inter, and Borussia Dortmund and PSV still feeling somewhat regretful.
We looked at the increase in goals in the Premier League last season. The 2022-23 campaign saw 2.85 goals scored per game, an increase from the previous season’s 2.82, which itself had been the joint-most since the 1967-68 campaign (3.03).
With 283 of the 380 Premier League games played in 2023-24, we are currently seeing an incredible 3.24 goals per game, an increase of 0.39 on last season’s record. That’s the most goals per game in England’s top flight since the 1964-65 season (3.34).
If this rate continues until the end of the campaign, there will have been 1,231 goals scored in the Premier League, almost 150 more than we were treated to in 2022-23 (1,084).
Last season, 16.8% of Premier League games featured five or more goals. That was up on the average from the previous 10 seasons of 14.2%. This season, a whopping 21.6% of games have seen five or more goals; that’s more often than one in five matches.
One factor has been that the teams near the bottom of the league have been conceding more. This time last season, the bottom six in the Premier League had conceded a collective 282 goals. This term – swapping Everton for Crystal Palace due to the former’s points deduction being the reason they sit below the latter – teams in the same places have collectively let in 350 goals.
Sheffield United are on course to concede the most in a 38-game Premier League season, and perhaps even in any (including 42-game seasons). Their 74 goals against after 28 games is just 15 shy of Derby County’s 38-game record in the Premier League, while if Chris Wilder’s men concede 27 or more in their final 10 games, they will break Swindon Town’s overall record (100 in 42 games). Their 2.64 goals conceded per game so far is well ahead of both Derby (2.34) and Swindon (2.31).
One team who have greatly contributed to the rise in goals this season are Newcastle United. Eddie Howe’s men have had a turbulent campaign, managing a lot of injuries as well as a hectic Champions League group stage earlier in the season. That doesn’t entirely explain how they went from scoring 46 and conceding 20 at this same stage last season, to scoring 59 and conceding 48 this term, though. That means Newcastle games have seen an extra 41 goals scored so far in 2023-24. In fact, only Liverpool’s matches in 2013-14 (3.97) have witnessed a higher goals-per-game average than Newcastle’s this season (3.82). Fun for the neutral; stressful for the fans.
Is this just the way modern football is going? Well, quite possibly – and we’ll get to that – but it’s not a theme being followed across Europe just yet.
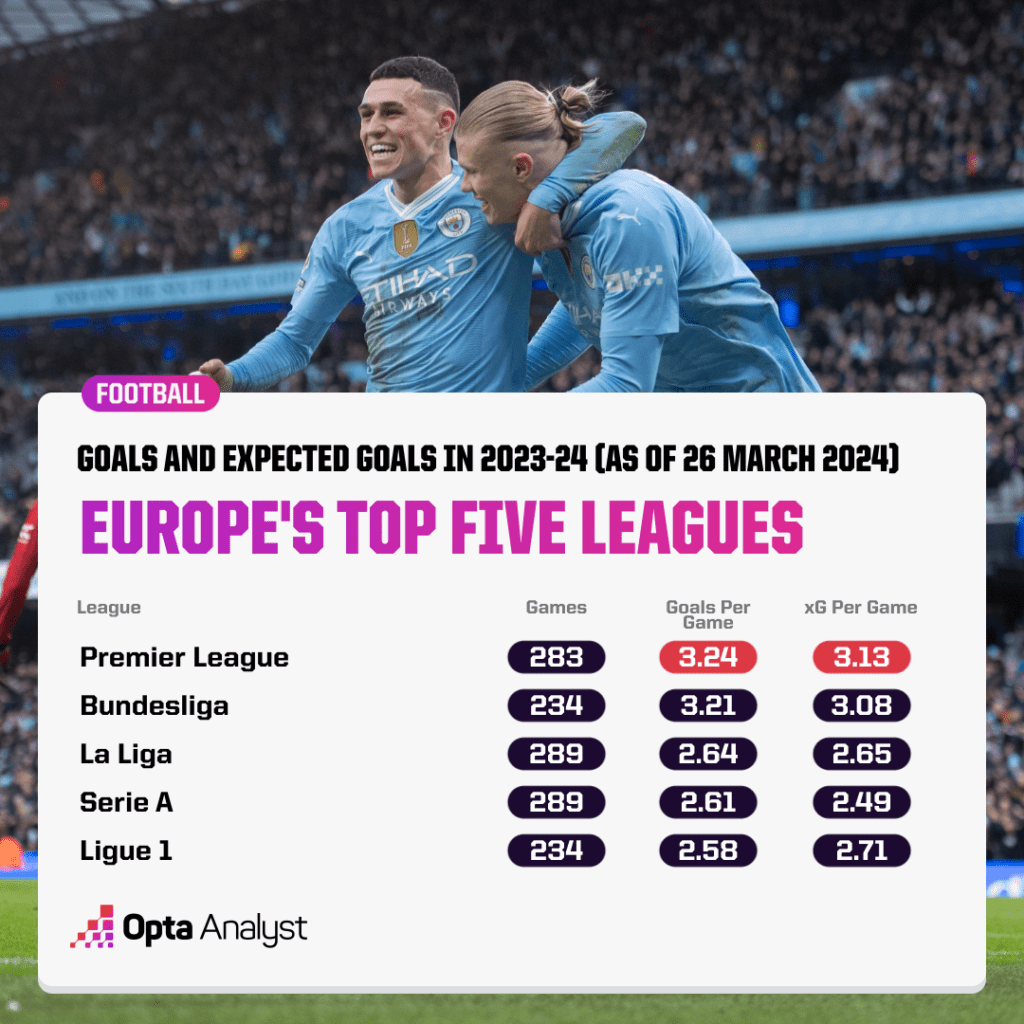
The only one of Europe’s other top five leagues that has seen anywhere near as many goals per game in 2023-24 is the Bundesliga (3.21), which has consistently been a high-scoring league in recent years anyway. The previous five seasons in Germany’s top flight all saw more than three goals per game on average.
However, La Liga has seen a more modest 2.64 goals per game, just ahead of Serie A (2.61) and Ligue 1 (2.58). That follows the expected goals (xG) model, with La Liga’s total xG at 2.65 per game, Ligue 1 at 2.71 and Serie A down at 2.49. The Premier League and the Bundesliga once again stand out, at 3.13 and 3.08 xG respectively.
Could it just be that the English and German leagues are more creative/chaotic or less defensively sound? They are seeing more shots than their fellow top five, but not by much. The Bundesliga is averaging the most shots per game at 27.4, slightly ahead of the Premier League’s 27.2. However, Serie A and Ligue 1 aren’t far behind at 25.4 and 25.3 respectively, while La Liga is seeing 24.6 shots per game.
The volume of shots could be a factor when you look at this Premier League season compared to recent ones. The average of 27.2 shots per game in 2023-24 is the highest the league has seen since 2012-13 (27.8). However, the 2021-22 season saw 1,071 goals scored from 9,747 total shots (25.7 shots per game). Last season, 1,084 goals were scored from 9,609 shots (25.3 shots per game), or 13 more goals from 138 fewer attempts.
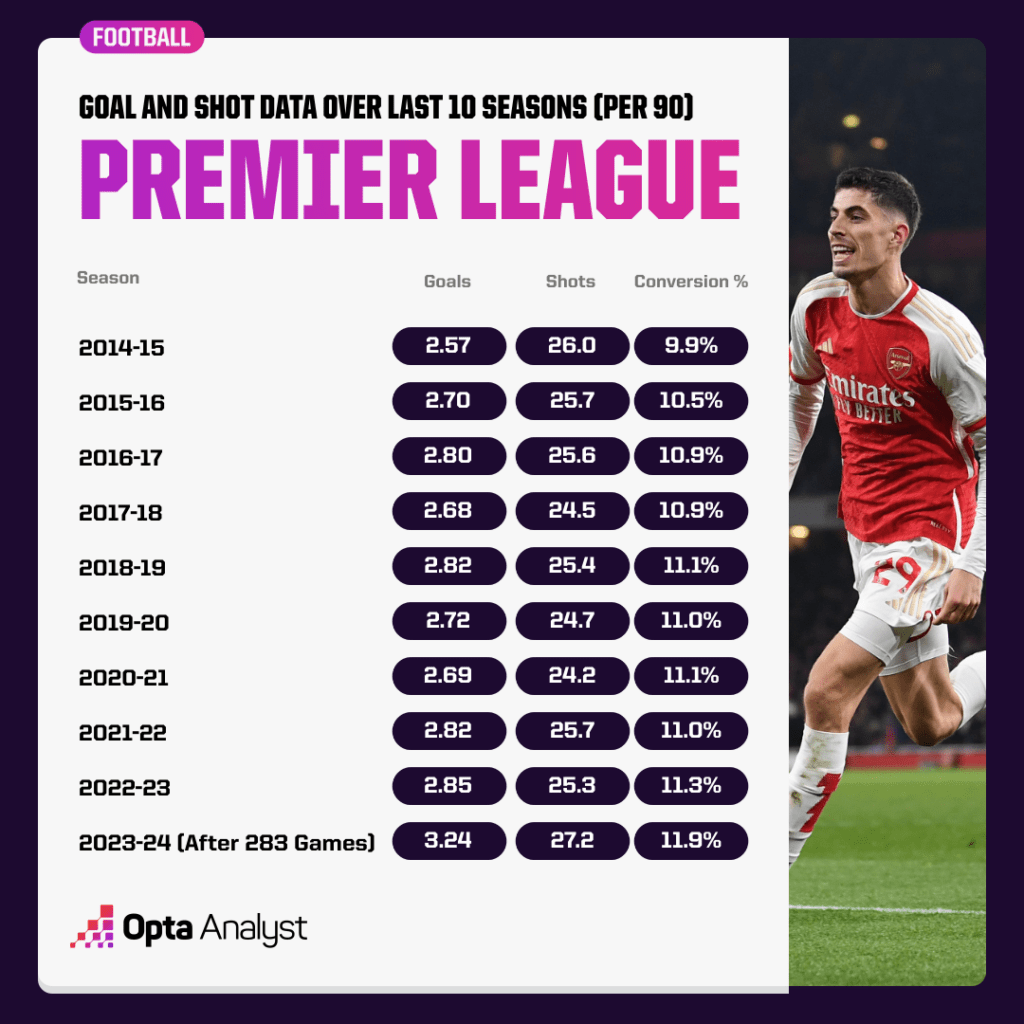
Last season’s numbers follow a trend that has been apparent for quite a few years, that players seem to be getting better at finishing. The conversion rate of chances in the Premier League has steadily risen since Opta has been collecting this data. Prior to the 2012-13 season, only one campaign since 1997-98 had seen an overall conversion rate of over 10.0%; since (and including) the 2012-13 season, only one campaign has seen the conversion rate drop below 10.0%, while each of the last five season have all seen it creep above 11.0%.
This season’s shot conversion rate is up at 11.9%, a 0.6% increase on the next highest on record (last season’s 11.3).
This all points to the probability that improvements in analytics, coaching and shooting technique appear to be doing the trick. Players seem to simply be better than ever at finishing chances.
A rise in the conversion of chances is something we have seen across World Cups, too. Being four years apart, FIFA’s showpiece international tournaments are usually a good barometer for football trends and as you can see below, shot conversion rate has generally improved in the last 10 editions, especially the leap between 2010 and 2014 when the involvement of analytics in elite football really increased.
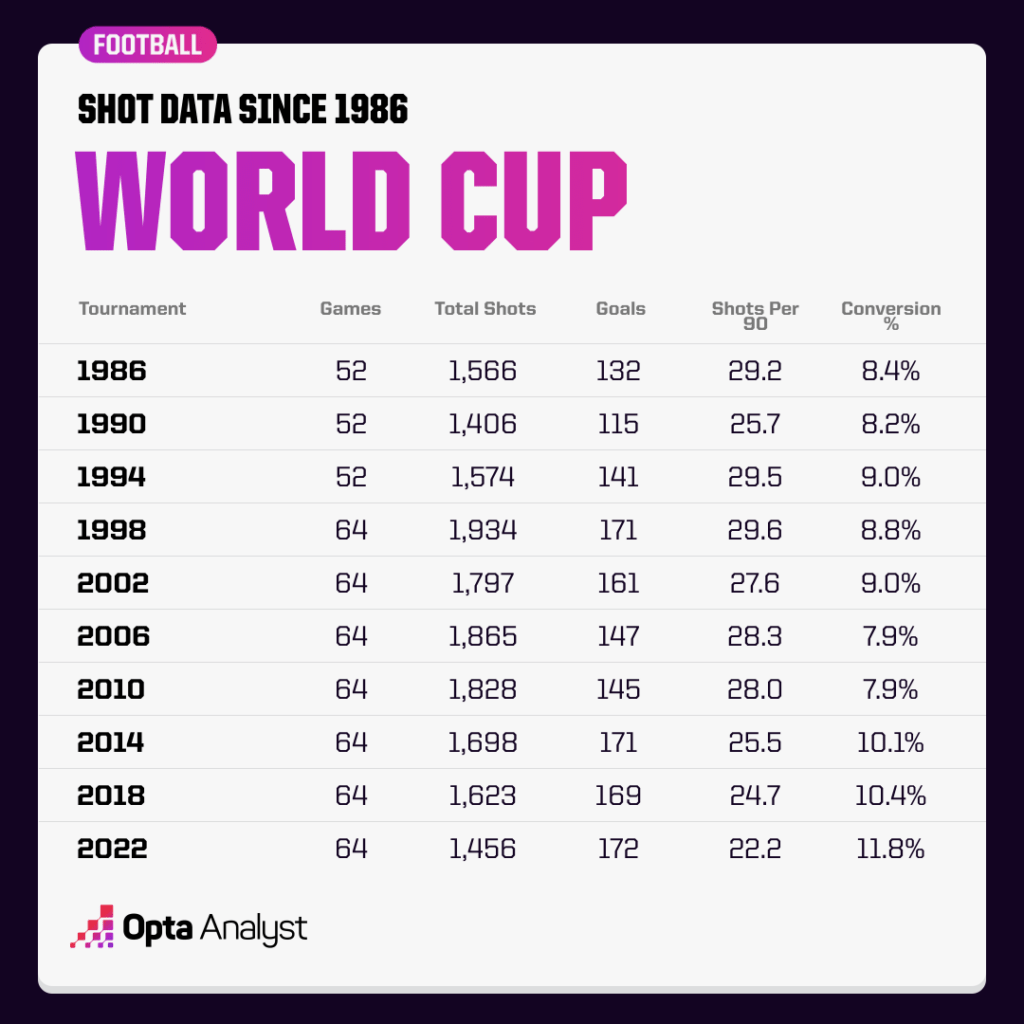
The 2022 World Cup saw more goals scored than any other in history (172), even though the number of shots per 90 reduced, suggesting teams were more selective and effective in their shooting.
We do have to ask if it really is just players getting better at finishing or if goalkeepers are getting worse at keeping shots out. The 10 Premier League seasons on record with the fewest total saves are each of the last 10 campaigns, though you probably could have guessed that given the rise in shot conversion.
It could be argued the focus on goalkeepers using their feet more might be a factor. Are they focusing training on saving technique as much as they used to? Is their positioning for making saves worse because they’re having to think about being available for build-up play when in possession more now? It’s not something easily discernible using data, and it would seem rather mean to make assumptions. Goalkeepers are mostly bigger than us too, and we don’t want to upset them, frankly.
A likelier explanation is that teams are getting smarter in knowing when to shoot and making sure they create higher quality chances. The average for shots from outside the penalty area since 2003-04 up to the end of last season is 11.3 per game; this season it has been just 9.0. The average for shots from inside the penalty area since 2003-04 up to the end of last season is 15.3 per game; this season it has been 18.4, so teams are working out how to forge more chances from inside the box than ever before.
In fact, there have already been more shots from inside the box this season in 283 games (5,196) than there were in the entire 2005-06 campaign (5,152 in 380 games).
As you can see from the graphic below, the average shot distance in the Premier League has been steadily going down over the years, showing that teams are finding ways to get closer and closer to goal. The average shot distance of 14.9 metres this season is down 0.5m from just two seasons ago.
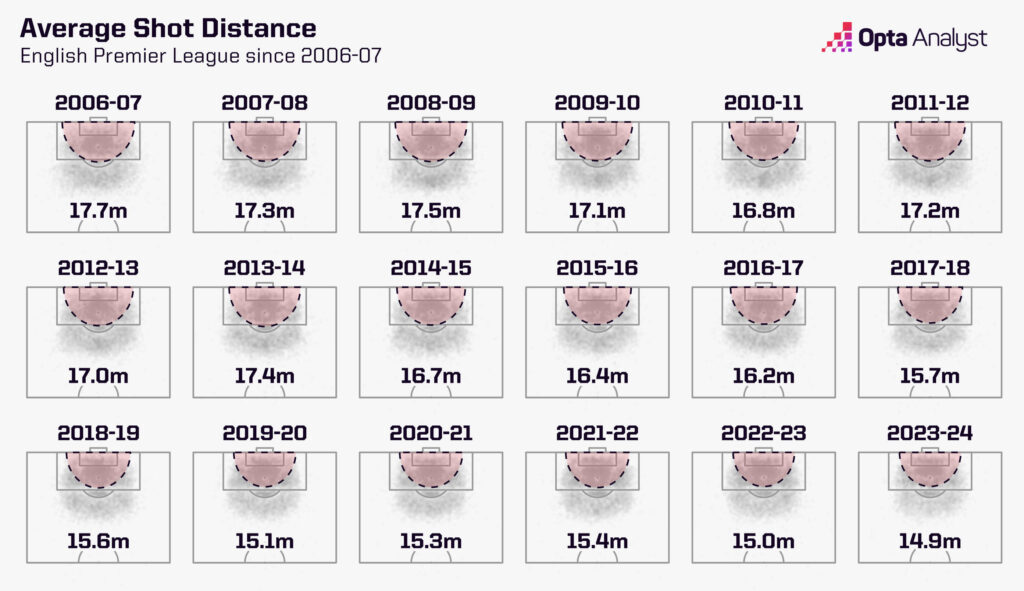
If you were curious, the number of headed attempts per game has remained surprisingly steady, with the average of 4.0 since 2003-04 carrying on at 4.0 again in 2023-24.
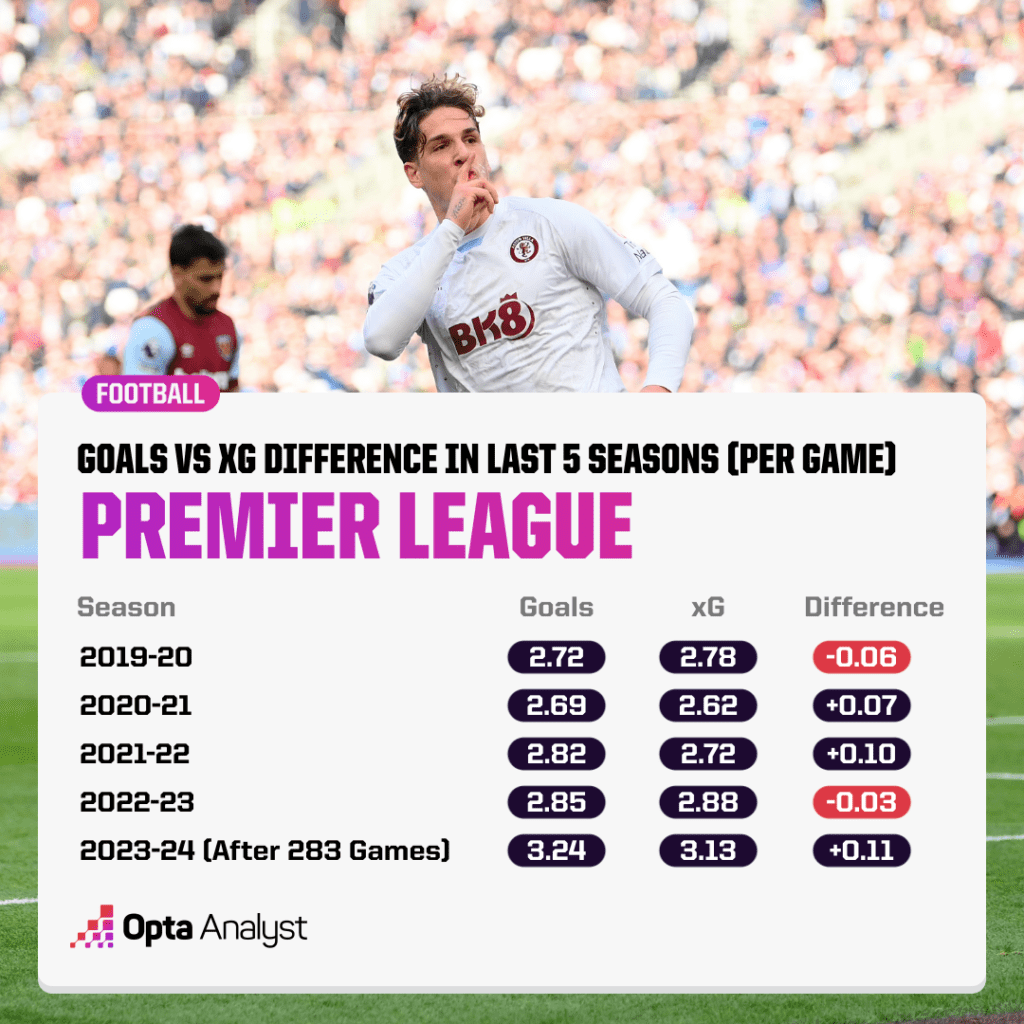
With the increase in chances closer to goal, it won’t be much of a surprise to learn that the average xG per game in the Premier League has also risen this season, but that doesn’t fully explain the increase in goals. For measurable campaigns for xG (since 2019-20), this season is currently seeing the biggest overperformance overall against xG, with games producing 0.11 goals per game above the xG.
For those who like to yell “just launch it!” at players passing out from the back, we don’t want to say you might be onto something as the pros clearly outweigh the cons (or presumably it would have occurred to elite teams to stop doing it by now), but there have been more goals from high turnovers in recent years.
The 2023-24 season has already seen 93 goals scored (0.33 per game) after high turnovers, 15 more than in the entire 2021-22 campaign (78 – 0.20 per game), and just four shy of last season’s total of 97 (0.25 per game).
Luton are the only team yet to score a goal following a high turnover this season in the Premier League and have conceded the joint-most along with Bournemouth (nine). Rob Edwards’ side are still finding ways of scoring goals, though, having managed 42 after 29 games. That means they’re on course to score 55, which, were they to do so and still go down, means they would match Blackpool (2010-11) for the most goals scored in a season by a Premier League team who were relegated.
It helps that 14 of their goals have come from set pieces (excluding penalties), the third most in the Premier League this season.
With Arsenal scoring an impressive 19 set-piece goals this term and set-piece coach Nicolas Jover getting deserved credit, it feels like teams having specialist coaches for that area of the game is also paying off. However, 72.3% of goals in the Premier League this season have been from open play, the second-highest percentage on record (since 2004-05).
One factor has been the decline in goals from direct free-kicks. Only six have been scored this season, compared to 39 just a decade ago in 2013-14. Seventeen found the net in 2022-23, with the 0.79 direct free-kicks attempted the fewest on record in a Premier League season. That has slipped again to just 0.72 this season, down from a peak of 1.79 per game in 2008-09.
There has also been a drop in percentage of goals that have come from indirect free-kicks, with this season’s 4.4% the lowest on record, though goals from corners is up at 14.3%, the highest percentage on record.
We’re also seeing a lot of penalties, with 79 awarded so far. There have only been three seasons on record with more spot kicks per game than 2023-24 (0.28), and as we recently analysed, more penalties than ever are being scored.
If you’ve got this far, though, you’re probably wondering why we haven’t yet mentioned ball-in-play time. Well, we thought it would be appropriate to leave discussion about elongated stoppage time until the end.
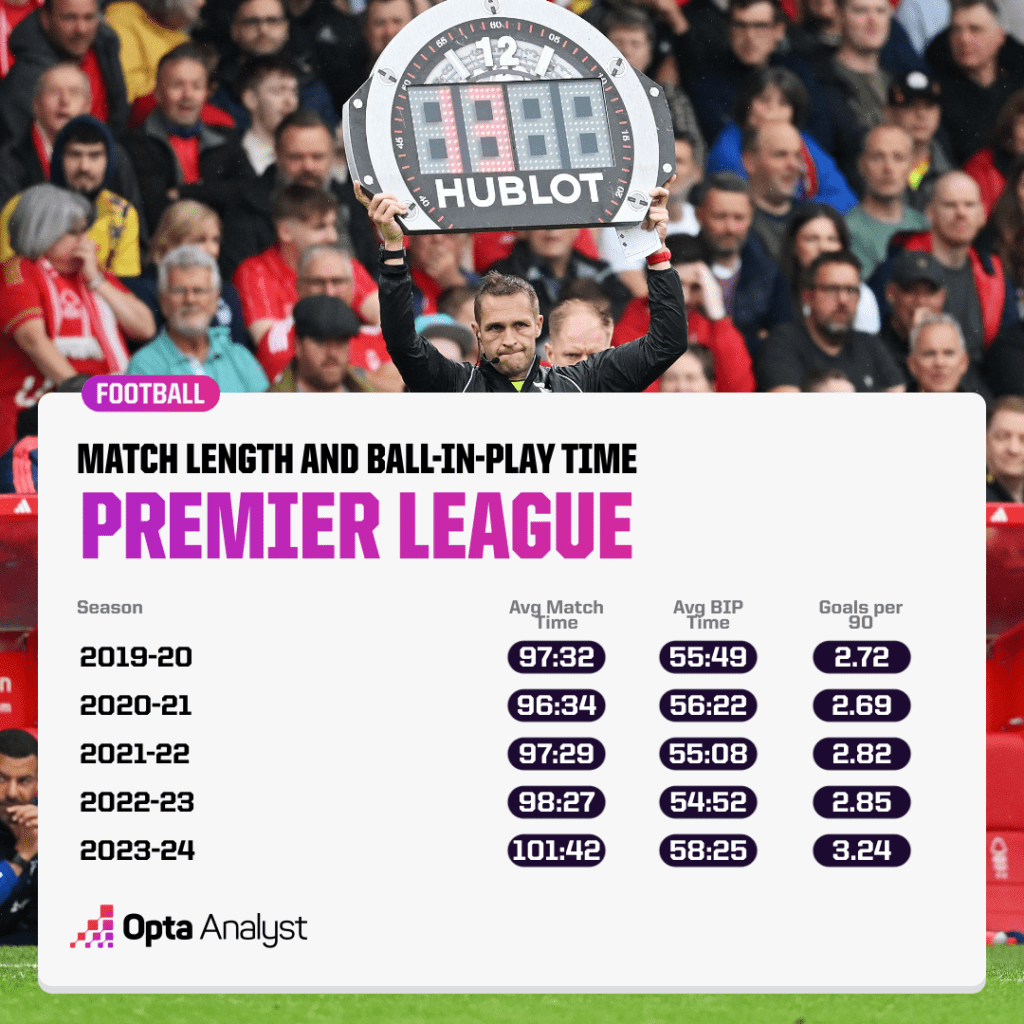
Yes, more football is being played, which would lend itself to the idea that it is leading to more goals being scored. This season has seen an average match length in the Premier League of 101 minutes and 42 seconds, a full three minutes and 15 seconds longer than last season. Ball-in-play time has risen even more, though, with an average of 58 mins and 25 seconds, three mins and 33 seconds longer than last season. That’s an increase of 3.3% for match length and 6.5% for ball-in-play time.
It is certainly an obvious reason for there being more goals, though doesn’t fully explain the 13.7% increase in goals per game from last season.
The debate around how much football has improved in quality over generations can never truly be settled given the numerous differentials, but it does seem that the answer lies in the detail. Coaches, analysts and players are getting smarter all the time, looking for the fine lines that can be the difference between finding the net and not, while having more time on the pitch to get that elusive goal is undoubtedly also helping.
Perhaps the next evolution will focus on defending, so don’t rule out the numbers slowing down or going the other way in years to come.
For now, let’s just enjoy the avalanche of goals coming our way, and imagine how many more there would have been if it wasn’t for VAR *shakes fist at nearest monitor*.
Enjoy this? Subscribe to our football newsletter to receive exclusive weekly content. You can also follow our social accounts over on X, Instagram, TikTok and Facebook.