Since we introduced FRACAS, the Official World Golf Rankings has drastically changed its model as there have been a number of ongoing critiques on both sides of the coin.
We view the changes as an improvement, but it is through the lens of, and we cannot say this enough, the Official World Golf Ranking (OWGR) as a qualification system. The OWGR is the governing body of international golf that is used by tournaments and tours to determine which golfers qualify for its tournaments. It is designed to tell the story of player performance in tournaments. It is not designed to be predictive of future performance.
This is fine. I’ll repeat… this is completely fine.
The ecosystem of worldwide golf is dependent on qualification. Anyone can theoretically qualify for any tournament by playing well enough, and that is perhaps what makes golf one of the most relatable professional sports. For this to work, there needs to be a system that rewards golfers for how they finish in tournaments. The OWGR aims to do just that.
Why FRACAS is Needed
In our intro to FRACAS, we discussed why ranking players in worldwide golf is difficult. We examined the main issues of sample size, variety of courses played and strength of field. All of which are worthy of a review.
Remember that while the OWGR is designed to tell the story of what has happened as a means for qualification, FRACAS’ goal is to predict what will happen in future tournaments. There is some overlap between the two ideas, but it is an important distinction.
Our thoughts on the sample size issue remain the same. While golf is played across the world year-round, the sample size for individual golfers remains an issue. Most golfers tee it up between 15 and 25 times per year, which is not enough to truly evaluate golfers in a predictive way. The goal is to rank golfers against their peers while also detailing golfer “style” and a larger sample size is needed.
While the rules of golf are nearly universal, course design plays a major role in how a tournament will play out. Courses can be easy or hard and have high or low variance in scoring.
More than that, courses themselves can vary wildly from round to round based on weather conditions, tee boxes and pin locations. Well-designed courses can be manipulated by greenskeepers to challenge just about any skill level. When predicting future performance on a course, we need to know the ways a course can play.
Strength of field is where we’ve changed our mindset the most from our initial calculation. Originally, we used the OWGR field strength values in our own modeling, relying on the ranking system used by the OWGR for decades. After extensive research, we have determined a better way was needed.
Now, we’re creating our own strength of field metrics.
Our Model Then vs. Now
First some general review… FRACAS (Field Rating And Course-Adjusted Strokes gained) is our proprietary ranking system that equates performances from tournaments worldwide into a single ranking system.
The model uses a player’s performance relative to his or her peers on each hole in each round to create a plus-minus for how many strokes better or worse a golfer is than a world-class golfer. We incorporate both short-term and long-term baselines into the model, using exponential decay to appropriately weigh recent performance and long-term performance.
Golfers have an overall FRACAS value and a FRACAS value for each type of hole.
Strokes-Gained Values: So what exactly has changed? First of all, we’ve expanded our coverage to every OWGR-sanctioned event and added in LIV, some USA domestic mini tours, and we’re working on adding NCAA golf. With so much coverage, and with golfers playing several tours within a season, we examine golfers who played on multiple tours to see how their strokes-gained values differ from one tour to another.
This gives us a baseline strokes-gained value, relative to the PGA Tour (see chart below).
We combine these baseline values with every golfer’s raw strokes-gained value, or how many strokes he or she gains on the field per round, to create a tour-adjusted strokes-gained value for each player (only slightly more complicated than raw strokes gained plus tour adjustment).
Strength-of-Field Values: We then do one final tune-up of the strength-of-field values by examining the exact composition of the field. This allows us to differentiate field strength within each tour.
For instance, the Puerto Rico Open and Arnold Palmer Invitational (API) are both PGA events, but using this methodology, we can say the field strength for Puerto Rico was .072 strokes worse than the PGA average while the API was .012 strokes better than the PGA average.
We perform this modeling at the round level to account for field strength changes after a cut.
Hole Variety: We’ve made another big change to how we separate hole types. In our original modeling, we had five types of holes: short par 3s, long par 3, short par 4s, long par 4s and par 5s.
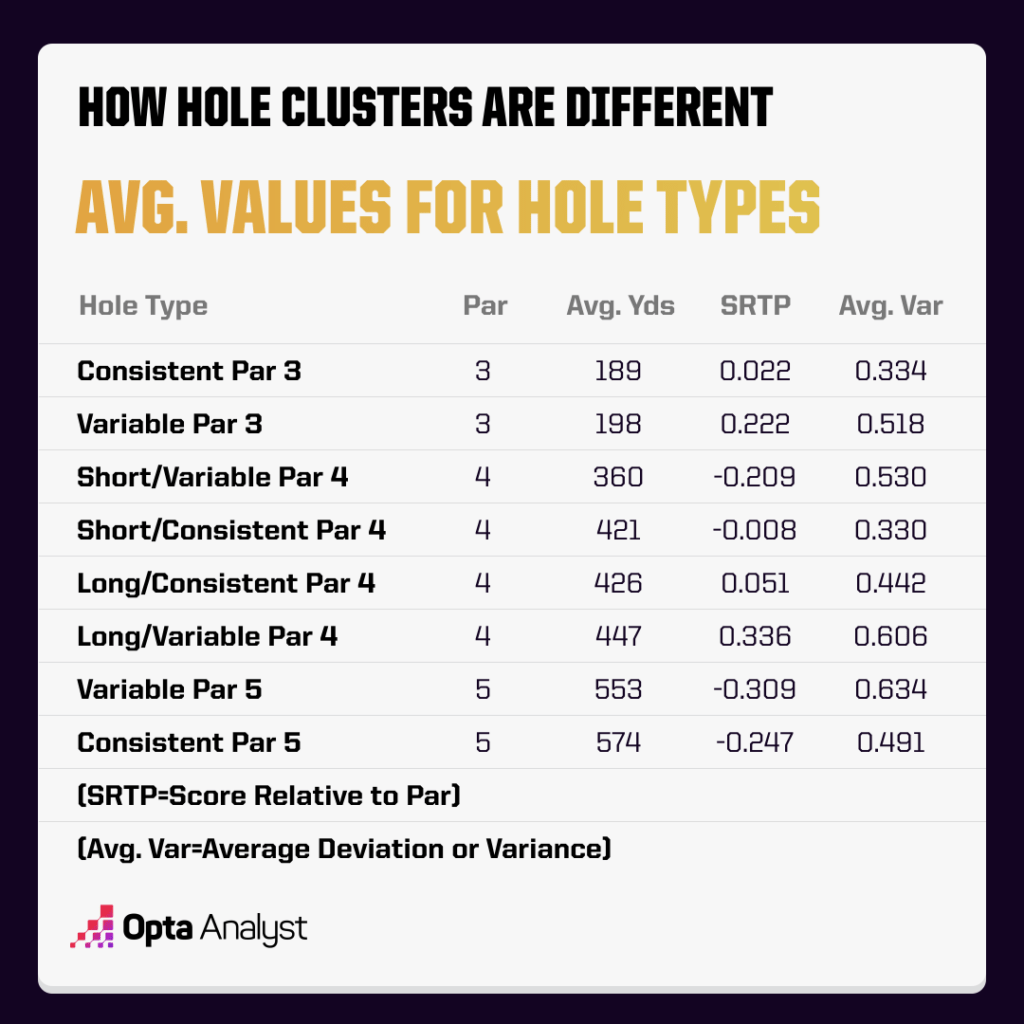
We’ve gone through several iterations since, but have settled on eight hole types using k-means clustering. Including score variance by hole was key for the model, but it did make naming the hole types more difficult. Here’s what we came up with: consistent par 3s, variable par 3s, short/variable par 4s, short/consistent par 4s, long/consistent par 4s, long/variable par 4s, variable par 5s, consistent par 5s.
The “variable” holes are generally the most exciting on the course. Par 3s over hazards, drivable par 4s, long U.S. Open-style par 4s and scorable par 5s are typical examples of these types of holes. The consistent holes are the holes that typically see a lot of pars. Par 3s with no hazards and pin positions that aren’t particularly accessible are good examples.
Birdie is a great score and bogey is a terrible score, but most golfers hit it to 25 feet and have an unlikely birdie putt.
Unlike our previous categorizations, there is significantly more distance overlap between cluster types.
The 17th hole at TPC Sawgrass only plays around 130 yards, but it is almost always classified as a variable par 3 because of how many big scores are posted.
Applying the Model to Simulations
Ranking systems are great, but creating models to predict who will win a tournament is where the real fun is. Field strength, field size, rounds, the type of course and whether or not there is a cut are all important factors in determining how likely a player is to win.
This also has ramifications for awarding performance points based on how players finish in tournaments.
Our tournament simulation model creates probabilities for each possible score on each hole on the course. We use a “One vs. Rest” logistic regression model to create probabilities for how the field will score for every course and tournament in our database.
We then run through each player and give them a plus-minus for each score on each type of hole. For example, our top-ranked golfer Jon Rahm is featured in the chart below. As you can see, his birdie rate is significantly higher than expected on every hole type and his bogey rate is much lower than expected.
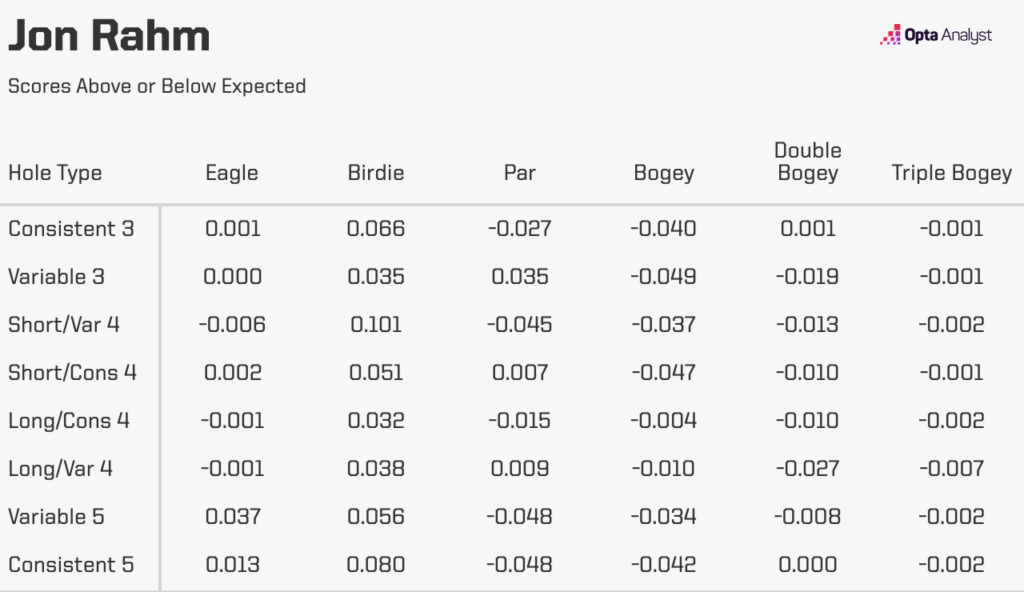
The biggest influence FRACAS has on our simulations is determining field strength. These plus-minus values for each golfer are calculated without considering field strength. They represent how a player has scored relative to the golfers they have played against.
When predicting scores for a new tournament, these numbers need to be adjusted for the strength of the field. Rather than a linear adjustment across every hole type, we’ve modeled out how moving up or down in field strength impacts a golfer’s score probabilities on each type of hole. Changing field strength exacerbates performance on holes with high variability, but consistent hole types have smaller adjustments.
These adjusted plus-minus values are combined with the course the golfer is about to play and these score probabilities are used in 100,000 simulations to determine each golfer’s distribution of placement outcomes.
FRACAS vs. OWGR
Let’s also do a short update on golfers we think are outperforming their OWGR values.
Our prior explainer highlighted seven golfers FRACAS identified as being undervalued by the OWGR.
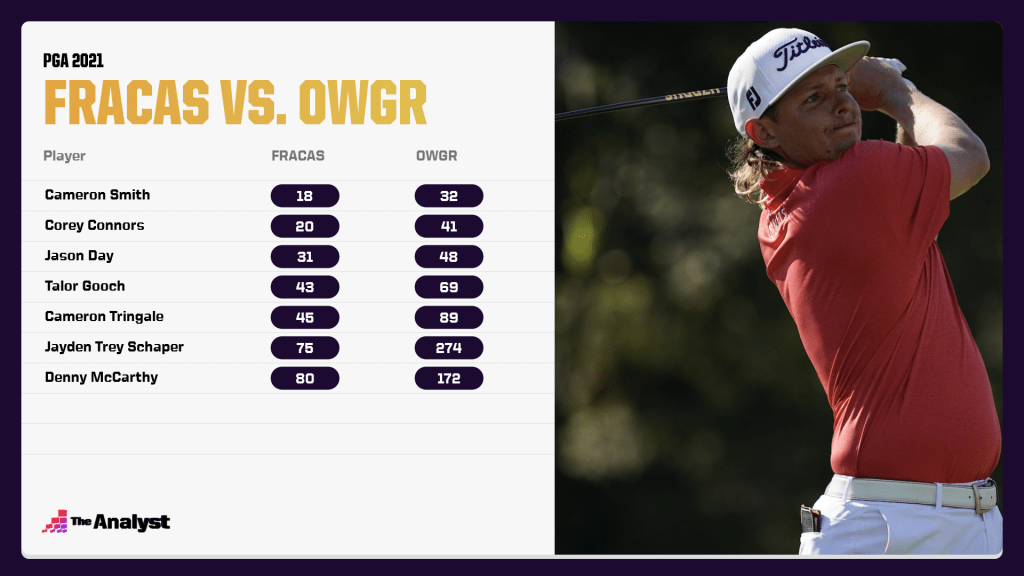
We did not intend to create a list of golfers LIV should target, but alas. Apart from Schaper (a now-corrected issue with field strength), the list aged fairly well.
Since then, Smith has won four tournaments including The Players and The Open, topping out at No. 2 in the world. Conners spent most of 2022 around 30th in the world, but is now back to 40th. Day had a rough 2022, falling below 150th, but he’s since surged and is now up to 37th.
Gooch rose all the way to 32nd before leaving the OWGR world for LIV. Tringale was on a similar path as Gooch, cracking the top 50 before also leaving for LIV. McCarthy has steadily risen since publishing and is now 58th in the world.
Let’s do it again!
We’ll ignore LIV golfers for now. LIV tournaments do not receive OWGR points due to violating several of the OWGR’s qualifications, so Matthew Wolff being 126 places too low is more a reflection of where he is playing rather than how he is playing.
We’ll also take out a few golfers who haven’t appeared in a while due to injury.
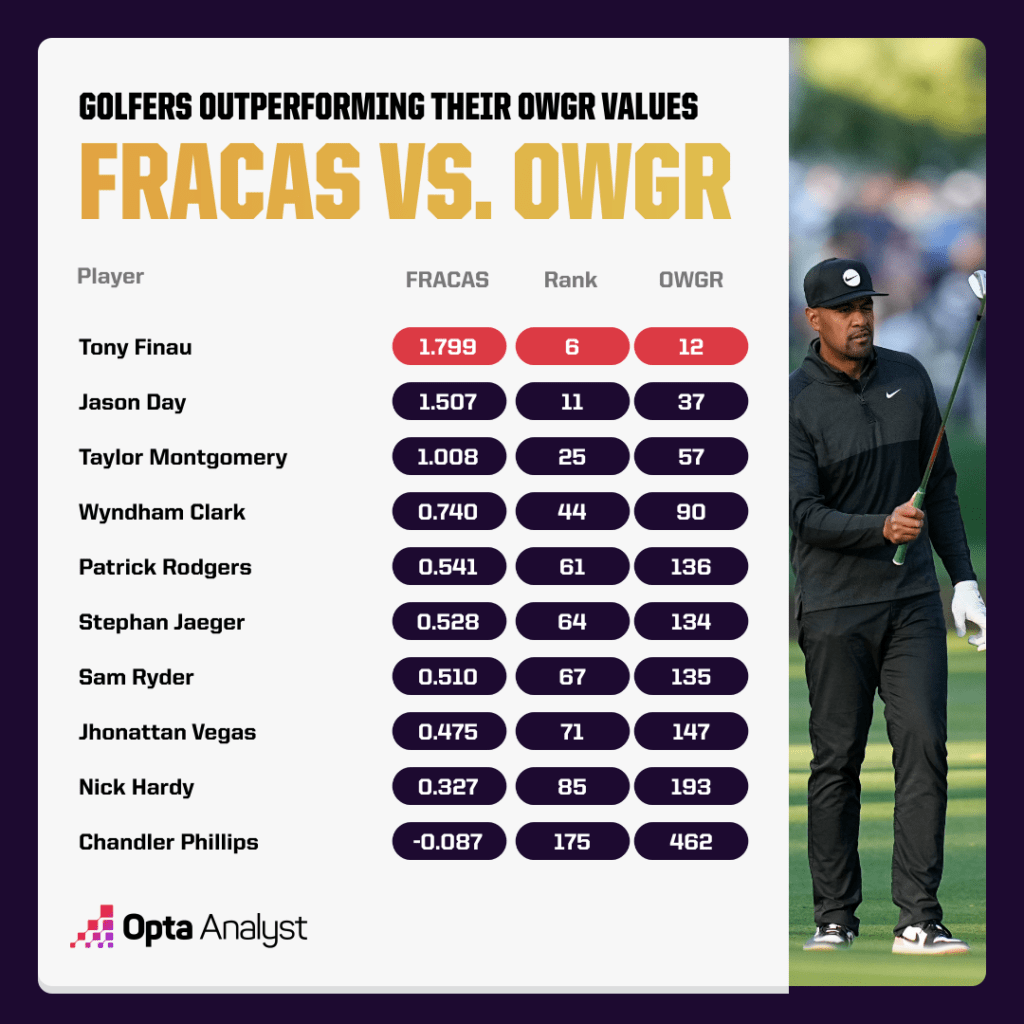
After a five-year drought, Tony Finau made it back into the winner’s circle four times between 2021 and 2022. This year, he has seven appearances and hasn’t finished outside the top 25 in any of them. He’s a great long/variable par-4 player and variable par-5 player, which bodes well for major tournaments in which players typically have to score when available and save par the rest of the way. Things continue pointing up for Finau.
Our lone repeat from our 2021 version is Jason Day, whose has nearly returned to full form in2023. He has top-10 finishes in four of six events, three of them “designated” events on the PGA Tour. He excels on every type of hole, though he doesn’t have a true strength as Finau does. If he wins this year, it’ll be four good rounds instead of one spectacular round covering up for a bad round.
Taylor Montgomery has had the highest production of the 2022 Korn Ferry graduate class. He started his full membership season with five consecutive top-20 finishes. And while he’s cooled a little, he has the skills to take down one of the more standard PGA events. A tournament like Rocket Mortgage in Detroit would be a perfect location for his maiden win.
Wyndham Clark, Patrick Rodgers, Stephen Jaeger, Sam Ryder and Jhonattan Vegas are all veterans who are playing consistently well this year. While it would be a surprise if they all broke through, seeing one of those five at the top of the leaderboard after a Sunday this summer would come as no surprise. Clark, Jaeger and Ryder are all of similar ilk to Montgomery. They excel when things are somewhat easy, but not true birdie fests. If they get in, Rodgers and Vegas are more likely to have a top-five finish in a more difficult tournament.
Nick Hardy has been a bit of a cut enigma. He consistently misses the cut by just a shot or two and is undone by just a few bad holes each week. He had a few stretches last year when he was a solid golfer, finishing in a tie for 14th at last year’s U.S. Open before taking some time off with an injury. We think better times are around the corner for Hardy.
A few names to watch are Chandler Phillips, Gordon Sargent and Ben James. Phillips really shined on the mini tours in 2022 after struggling on the Korn Ferry tour in 2021. He regained his Korn Ferry card for this year and has already come away with a victory. He’s spectacular when things are difficult. That doesn’t necessarily lend itself to success on the Korn Ferry, but he could find some success if he makes it to the PGA Tour after this year.
Sargent and James are both in the collegiate ranks. Just a sophomore at Vanderbilt, we’ll see Sargent at the Masters after he received a special invitation. His college season has been spectacular thus far. James is just a freshman, but he sits behind only Sargent and Michael Thorbjornsen in our work-in-progress NCAA rankings.