Traditional methods of rating a tennis player’s skill are severely limited. World ranking is a starting point but lacks nuance – a great run at a big tournament can elevate your ranking to new heights, despite an otherwise inconsistent season. At a more granular level, we can look at something like point win percentage. Yet, this lacks the context of opponent skill level – winning points against a top-100 player is not the same as a top-10 player.
Introducing Openskill ratings – a truer way to rank players.
What is Openskill Rating?
Openskill rating is a skill-based ranking system that aims to assess and track a player’s skill throughout a match, tournament and even throughout the season. Players are given a separate rating for service and return points. These ratings are then updated point-by-point, considering the current rating of the players.
In reality, these serve and return point ratings are actually given by distributions – like that seen below for Iga Świątek’s return point rating. And here’s where the power of this rating system is shown. The width or “spread” of this distribution describes a player’s consistency as well as our certainty in their rating. For example, if a player is rather inconsistent then they will have a wide distribution. Or, if they haven’t played many matches, we are less sure of their rating and they will again have a wider distribution.
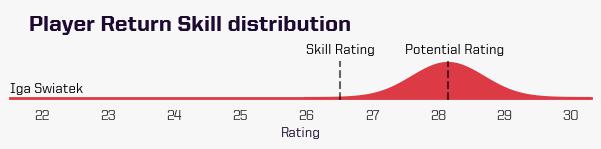
We define two ratings from this distribution – Skill and Potential ratings. The Potential rating represents their ability regardless of their inconsistency/uncertainty. As the name suggests, it aims to give an idea of a player’s potential performance level, even if that may not be achieved consistently. Skill rating, however, considers these factors to give us a better description of a player’s typical level. The result is a rating that incorporates a player’s own consistency and the opponents’ ability. (If you would like more of the mathematical details, see the bottom of this article).
Note: For this article, we have used 2021 and 2022 data to calculate the Openskill ratings for players on the WTA Tour, using over 400,000 data points. World Rankings are as of July 1 2022.
The World’s Best
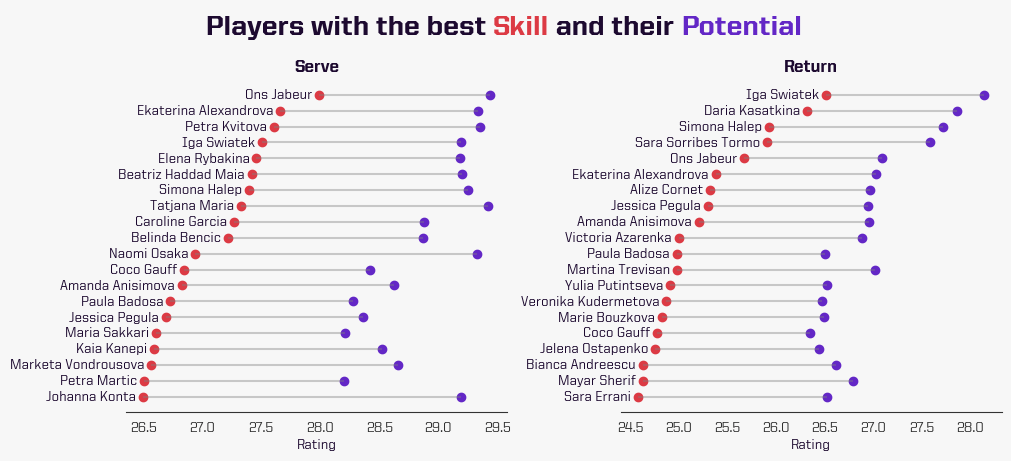
Let’s start by looking at the Skill ratings of the top 50 ranked players.
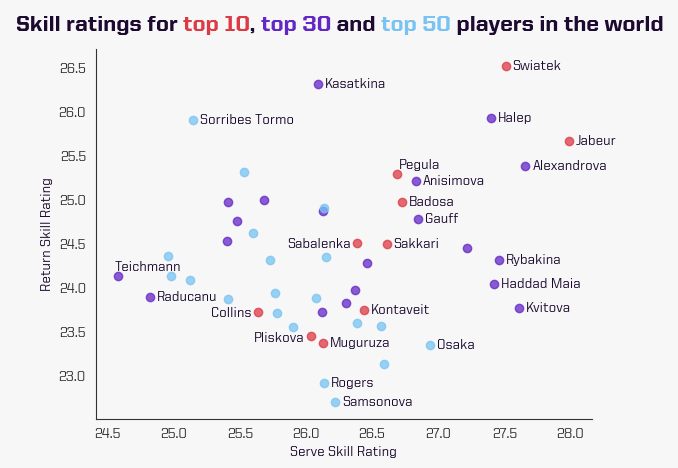
Iga Świątek and Ons Jabeur are two stand outs having the highest return and serve skills respectively – well deserving of their spots at world number one and two.
Simona Halep demonstrates well the limitations of traditional rankings. While she ranks outside the top 10 following an injury-hit 2021, her top Skill ratings suggest she remains among the best.
On return points, Daria Kasatkina and Sara Sorribes Tormo have some outstanding ratings, but their serve rating is not among the best. On the other hand, Petra Kvitová and Ekaterina Alexandrova have some of the highest ratings on serve points.
Skill vs. Percentage of Points Won
As mentioned previously, a high percentage of points won does not necessarily mean that the player’s Skill rating will be higher. If a player has played against lower-level players, then the Skill rating will take that into account.
The graph below illustrates the players with the highest Skill rating on serve and return points with the respective point win percentage.
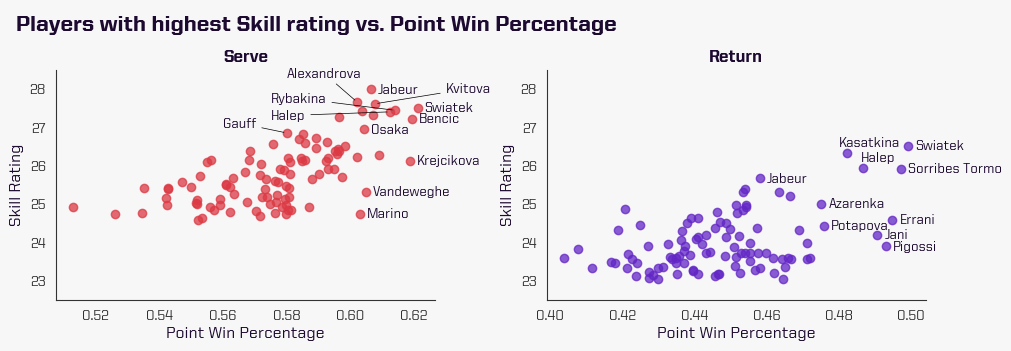
As we can see, a high percentage of points won does not necessarily translate to a high Skill rating. Players like Świątek, Belinda Bencic and Barbora Krejčíková have a high point percentage win on serve but do not have the highest ratings.
Similarly, on return points, Jabeur and Kasatkina have one of the highest Skill ratings without having the highest percentage of points won while players like Errani and Pigossi have a high percentage of points won and not a high rating.
This difference is caused by the quality of opponents they play against and the fact that the point win percentage includes all points in the 2021 and 2022 seasons while the Skill rating is current. Therefore, a player like Krejčíková, who won the 2021 French Open and won plenty of matches last season might have a high percentage of points won, but if her performance this season hasn’t been good, then her current skill rating will be lower. Recently, Krejčíková hasn’t had many wins and her matches played have been against lower-rated players which can explain why her serve rating is lower despite having a high point win percentage.
Skill vs. Potential Ratings
As discussed, these ratings don’t stand alone – they are part of a distribution. By comparing our Skill and Potential ratings we can find players whose inconsistency is holding them back.
For instance, a player such as Naomi Osaka who hasn’t played many tournaments in the past year, has a lower Skill ranking on serve points than Świątek who has had consistent results lately. However, Osaka’s potential rating is higher than Świątek’s, indicating that her serve skill could be higher, but her variance in skill is greater (her results have been more inconsistent, and she has played fewer matches).
Point Type
We’ve seen how players rate overall, but the point-by-point nature of the Openskill rating system allows us to dig deeper. What if we want to take a more precise look at a particular type of point?
Our data allows us to take a deeper dive into specific points to truly understand a player’s skill in different situations of a match.
Pressure vs. Early Points
Not all points in a tennis match are the same. For instance, we can split them into two categories – pressure and early points. Pressure points are considered game points and setup points (when a player is two points away from winning the game), while early points are the rest.
The following graph shows the top-20 players in the world with the difference in their skill rating for pressure and early points. A positive difference means that the player’s pressure point skill rating is greater than her early point skill ratings.
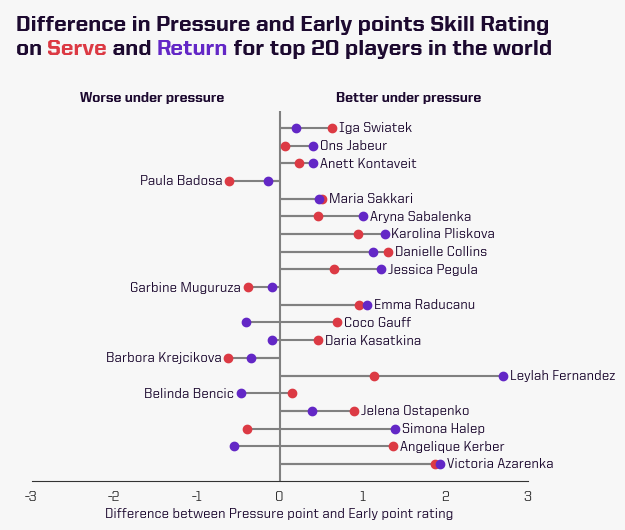
As we can see, most top-20 players have better ratings on pressure points, indicating that they perform better in pressure situations than earlier in the game.
Leyla Fernandez, 2021 US Open finalist, stands out as being a great player under pressure
having some of the largest differences on serve and return. On the other hand, Paula Badosa has a negative difference for both serve and return, suggesting that she struggles more in those pressure moments.
Rally Lengths
We can also split our data into points with different rally lengths: short, medium, and long rallies.
Short rallies are points that are won or lost in fewer than four shots such as an ace (length 0) or a return+1 winner (length 3). They are critical in tennis as most points in a match are won or lost in fewer than four shots. The server tends to have an advantage as she is the one starting the point.
We define medium rallies as points between four and eight shots. Lastly, long rallies are points that see nine or more shots played.
To compare different skill levels across different rally lengths, let’s look at the top 100 players in the world, and separate them into three groups: top 10, top 11-30, and top 31-100.
The goal is to see if their likelihood to win a point against a “default” rating (with a mean of 25 and a variance of 8.33), is different as the rally length increases and if there is a difference in that likelihood for the different groups of players.
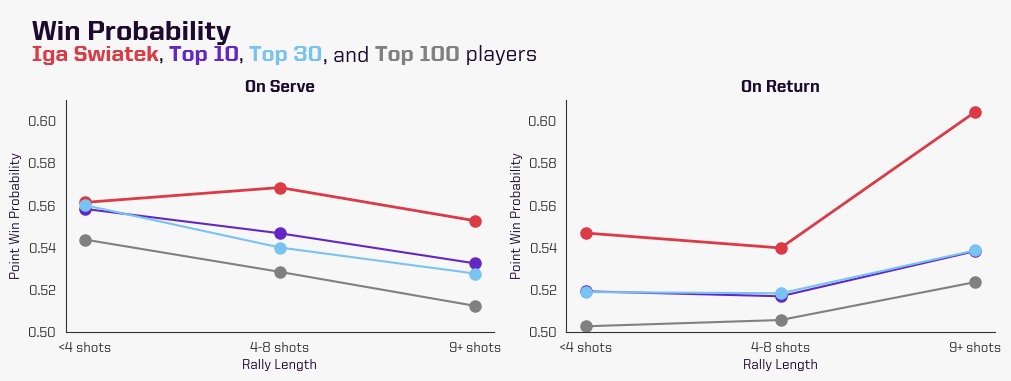
In general, we observe that as the rally length increases, the server’s probability to win the point decreases, while the returner’s probability increases. As the points get longer, the server loses her edge in winning the point, showing the importance of the serve and the serve+1 shots.
Overall, the serve and return win probability for the top 10 and top 11-30 players is almost the same on return. However, there is a larger gap between the top 30 and top 31-100 players’ point win probability.
We added world number one Świątek’s win probabilities to compare her with the rest of the top 100 players. An average point-win probability of 55% on return is fantastic, but a win probability over 60% for long rallies (9+ shots) is just remarkable! On short points on serve, Świątek’s probability to win is very similar to the top 30 players in the world. However, it is on extended rallies where she yet again sets herself apart.
Player Head-to-Head
After getting a detailed breakdown for specific types of points, we can also simulate a head-to-head matchup between two players to see who has a better chance to win on any given point, based on their skill distribution.
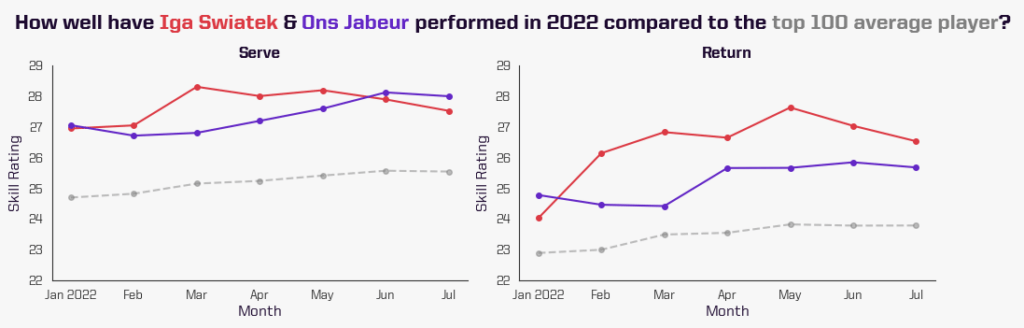
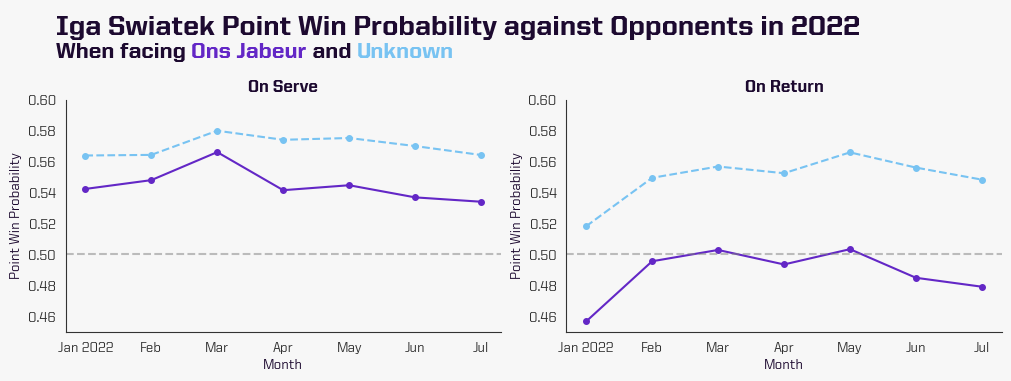
In this example, we have chosen Świątek and Jabeur in a head-to-head matchup looking at all points. It is not surprising to see that both players have serve and return skill ratings way above the top 100 average, as they both are top-performing players this season.
More interestingly, we can observe their probability to win a random point on serve and return points. When Świątek is on serve, her probability to win a random point against an “Unknown”, a player with a default rating (with a mean of 25 and a sigma of 8.33), is around 57% throughout the year while against a player who has a better return like Jabeur her win probability lowers to around 54%.
On Świątek’s return games, she is a favourite to win the points against an Unknown player but against someone like Jabeur her win probability decreases to around 50% or less.
We can also observe how the ratings and point win probability of each player have changed over the course of the season. For instance, Świątek’s ratings and probability to win a point on serve peaks in March during her undefeated run on hard courts which included wins at Indian Wells and Miami. Meanwhile, her rating and win probability on return peak in May, during clay court season, when she won Rome and Roland Garros.
Conclusion
Openskill ratings allow us to go beyond world rankings and simple metrics like point win percentage to quantify a player’s skill more accurately, by taking into account opponent ability and the player’s own consistency. The point-by-point nature of the ratings also open up exciting new possibilities; for example, rating by point type or rally length.
These ratings could be used for many different analyses and rankings. Other possibilities could include analyzing which players have higher win probabilities on a particular surface, simulating other head-to-head matchups, or showing players with the highest improvement in the season.
The Technical Details
Each player’s skill is characterized by a unique normal distribution with a mean (μ) and a standard deviation (σ). The mean would represent a player’s average skill level and the standard deviation would represent the variability of her level. Both parameters are then updated after each point is played. Because serve and return games are so different in a match, a player will have two different skill ratings: one for her serve points and one for her return points.
More information on this ranking system can be found in the original paper “A Bayesian Approximation Method for Online Ranking” written by Ruby C. Weng and Chih-Jen Lin1 and the Python implementation can be found here.
Ranking the normal distribution of all players is a difficult task. Therefore, we have created an Ordinal rating – which we will refer to as the Skill rating – to represent the current skill of the players and rank them. The Skill rating is defined as: μ − 3σ . This shows a rating for which there’s a 99.7% likelihood the player’s true rating is higher. A benefit of using this Skill rating, over something like the mean, is that it includes the variance. This means inconsistency and uncertainty in a player’s level are represented in her Skill rating.
The mean will be defined as the player’s Potential rating, with a 50% chance to outperform that rating. Comparing a player’s Skill and Potential ratings, as we will show, can provide a unique insight into how inconsistency/lack of matches affects their rating.
The big advantage of using a rating system like Openskill compared to other traditional ranking systems (e.g. Elo) is that variance is actually variable for each player. As a result, the variance can help us be more confident about a player’s true skill strength. For example, a player who has played many matches and has consistent results will have a small variance which means that we are more certain about her skill, and vice-versa.
[1] Original paper can be found here