Data and statistics have become far more prevalent in football over recent years. At the forefront of this is expected goals (or xG). Since xG was introduced in 2012 by Opta’s Sam Green , the metric has gone on to become one of the most widespread and insightful within football analytics.
Expected goals, or xG as it’s also known, provides fans with an insight into the quality of every chance in a game, and the likelihood of a goal being scored from them. Fast forward nearly a decade since Stats Perform first introduced the metric, and xG is now even more sophisticated.
The advancement and depth of data collection in football is a process that is continually evolving. With each addition and improvement, we gain more powerful insights into what is happening on the pitch. These data points can be used as inputs to power more complex models and evaluate chance quality more accurately than ever before.
What Is Expected Goals (xG)?
Let’s start with a quick refresher from our detailed explainer blog on the model.
Expected goals measures the quality of a chance by calculating the likelihood that it will be scored from a particular position on the pitch during a particular phase of play. This value is based on several factors from before the shot was taken.
xG is measured on a scale between zero and one, where zero represents a chance that is impossible to score and one represents a chance that a player would be expected to score every single time.
What’s New in Our Expected Goals Model?
Stats Perform’s AI intelligence has analysed over half a million different shots from previous competitions and seasons to power the latest model that calculates the likelihood of a chance being scored.
We take into account more than five times as many factors as the existing model and looks at how these variables affect the chance of a specific shot going in. These xG outputs are now created using a single model with a more advanced modelling technique called Artificial Neural Networks.
It still takes into account the fundamental features from the existing model, such as distance and angle, but these are now supplemented by notable added context, including:
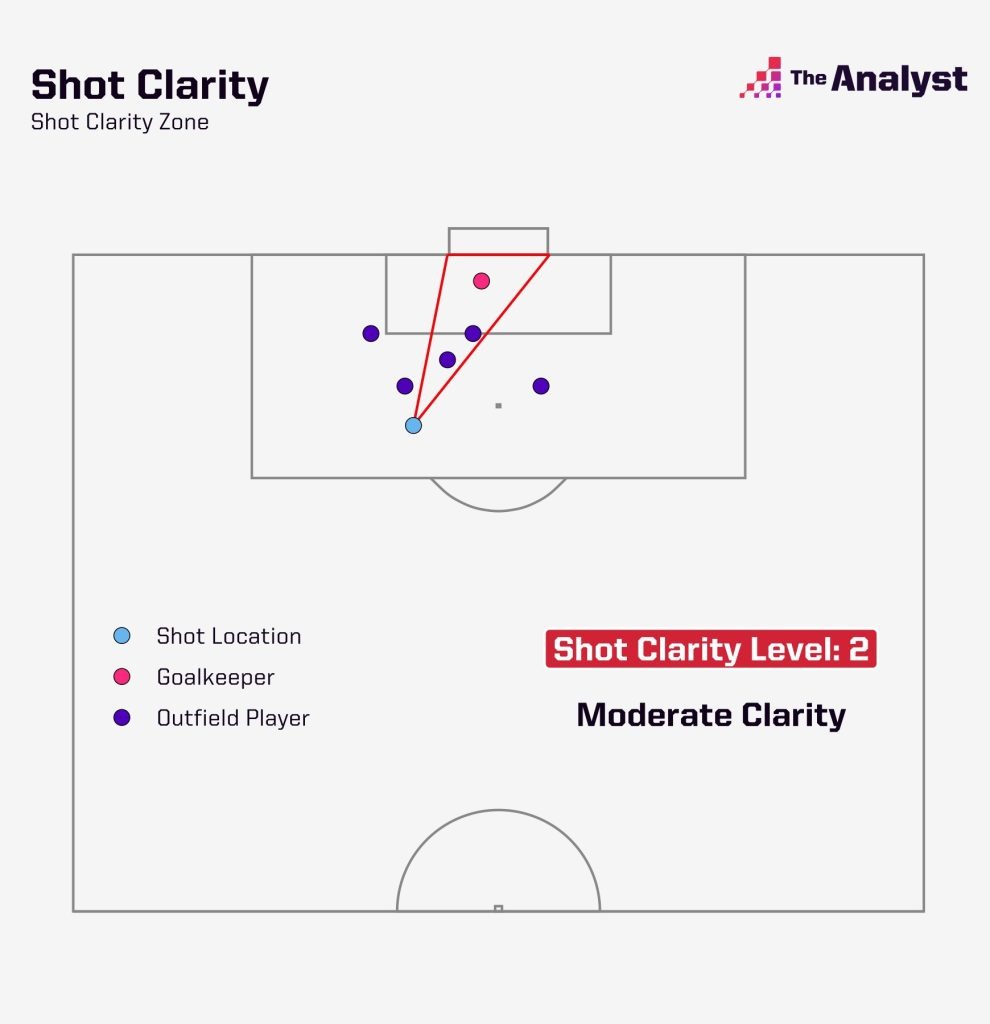
- The clarity the shooter has of the goal mouth
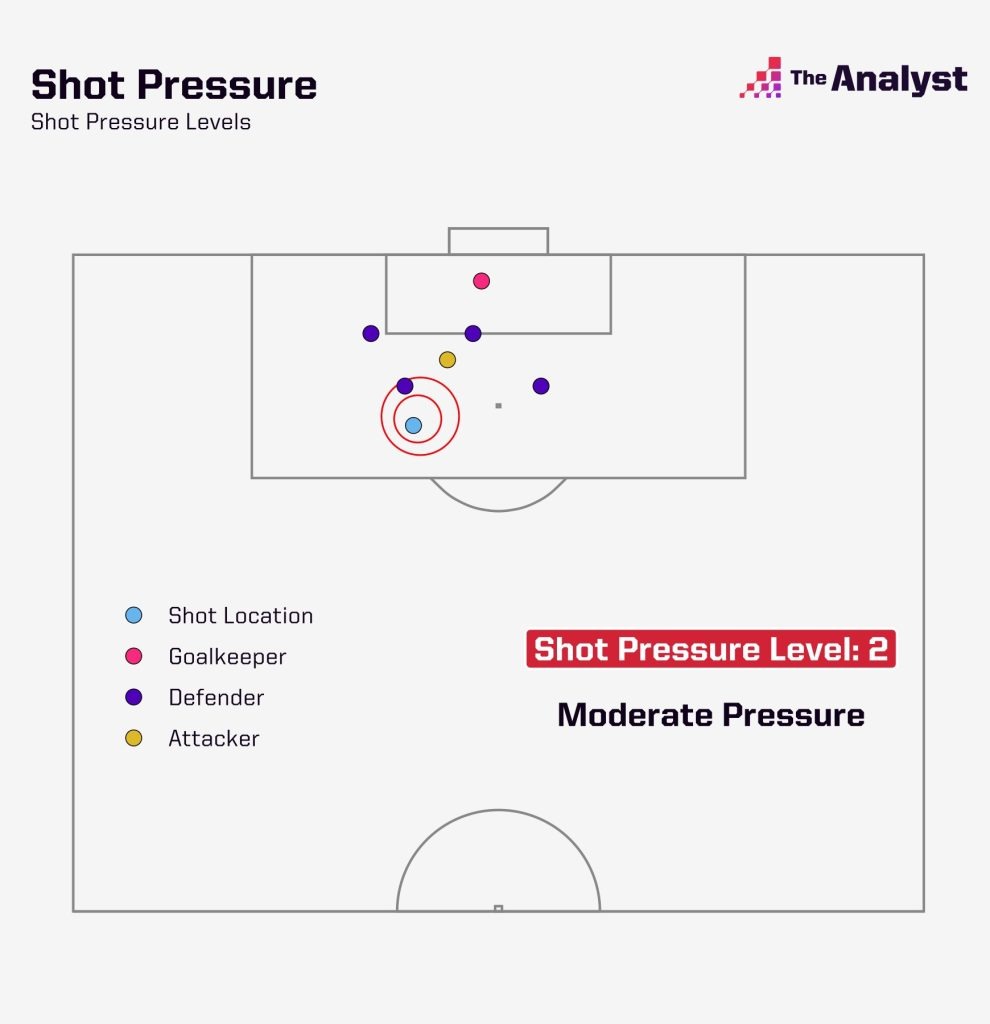
- The amount of pressure they are under from opposition players
- The position of the opposition goalkeeper that gives context on the:
- Distance to the shot
- Angle to the shot
- The goalkeeper’s position relative to the direct path of the shot to the centre of goal (line of sight)
- More granular shot type such as which foot the shooter used or whether it was a volley/header
- More granular detail on the previous action including the features of the assist but also other actions, such as if it came back off the post or the location of the previous event if it wasn’t assisted
- More contextual features such as whether it followed a rebound, was a first-touch shot, etc.
A reminder of how shot pressure and shot clarity look in action can be seen below and more information on these qualifiers can be found here.
Now that we are explicitly accounting for the context of the defenders and goalkeeper, it allows us to remove previously important features – such as the big-chance qualifier – while increasing the accuracy of the model. In fact, with the new context, we can evaluate these chances across a range of difficulty, recognising all situations with more granularity from pullbacks to open goals.
How Does That Affect the Outputs?
The unrivalled depth of Stats Perform’s Opta data powering the original model gave it the reliability to enrich over 2.5 million chances with xG values for more than 66,000 different players. The numbers don’t dramatically change in the latest version of the model because we are still measuring the same outcome. How likely is it that a goal will be scored from the given chance?
If we look at the 5,525 shots that have been taken so far in the Premier League 2021-22 season (up to the start of February 2022), we can see how the models compare. The average likelihood of a chance in the Premier League being scored this season was 11% (or 0.11 xG) in the existing model and 12% (or 0.12 xG) in the latest model, an average increase of just 0.01 between the xG values.
This is because the latest xG model’s new features enable us to evaluate chances on a broader spectrum of difficulty. We can recognise extreme situations such as open goals or chances where the shooter was under no pressure.
While it may only be a small sample, the 43 open goal chances in the Premier League this season were given a total xG of 22.7 by the existing model. With the additional granularity in the latest model detailing the goalkeeper and defender positions, these chances were totaled 30.6 xG, much closer to the 28 goals that were ultimately scored.
Similarly, the most noticeable reductions in xG values are intuitive changes that the new inputs enrich the data for too. The model recognises chances when the goalkeeper is smothering the attacker’s shot or when they are under extreme pressure from defenders – opportunities that might otherwise have been deemed very likely to result in a goal from the other data points.
How Does That Affect the Outputs for Players?
Let’s see how this affects the top players. Even at this stage of the season when total xG numbers for players are still fairly low, eight of the top 10 players for xG from the existing model remain in the rankings in the latest model.
If compared to the raw outputs for the top five players whose chances have the highest total xG so far in the Premier League this season, we find that most of their aggregates increase.
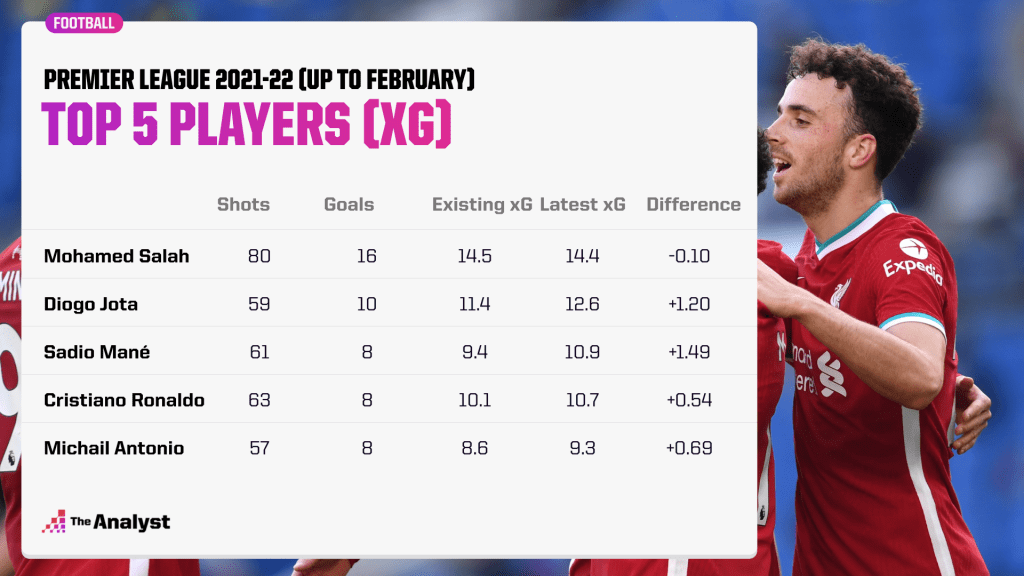
Liverpool’s Diogo Jota is a player who has excelled this season and, at the time of writing, finds himself only outscored by his Liverpool teammate, Mohamed Salah, this season. His total xG for the season has increased by 1.20 xG with the latest model but upon closer inspection of his 59 shots, it is clear to see why.
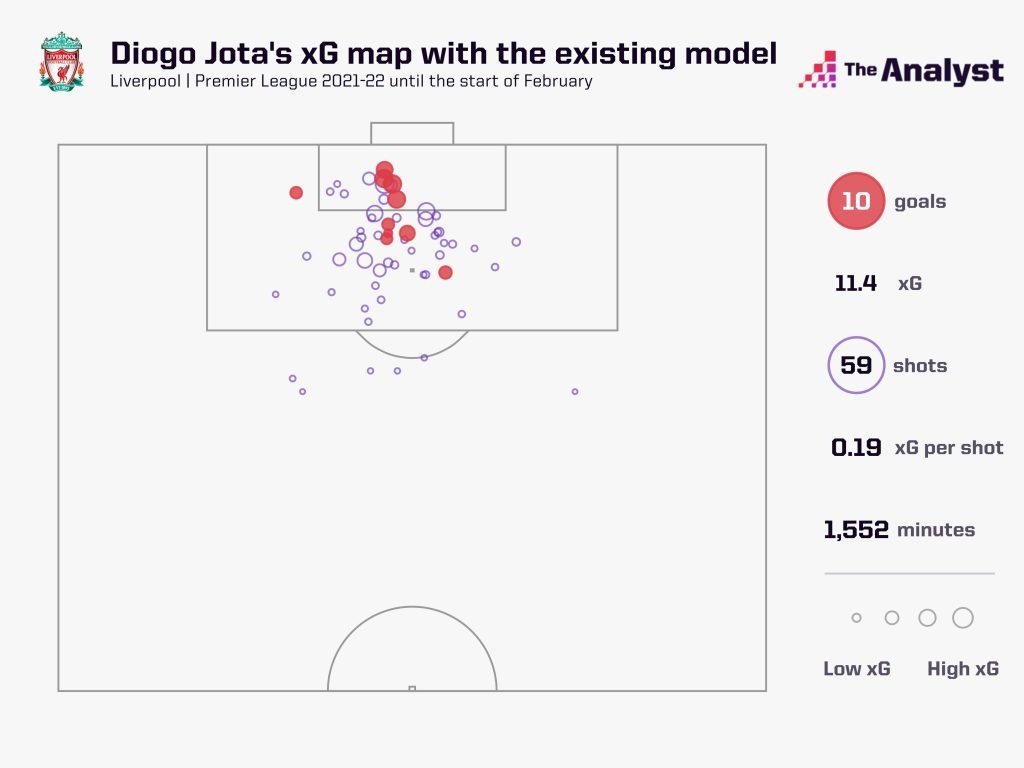
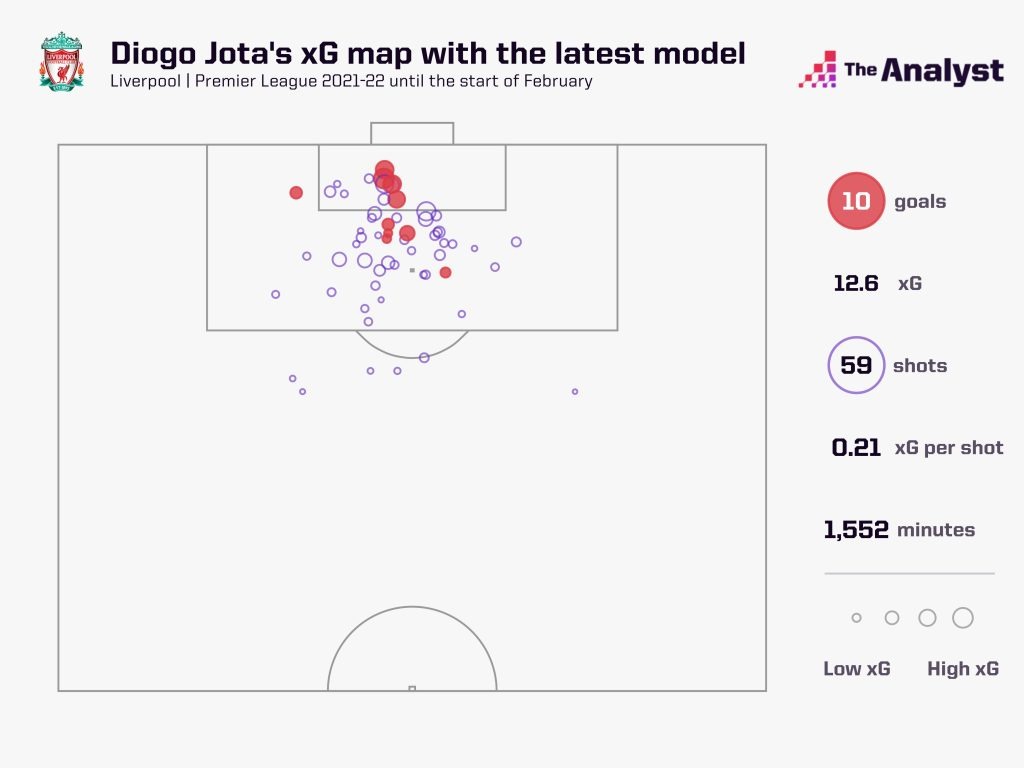
The shots that have changed the most in xG were from situations within the opposition penalty area where the latest model has been able to recognise the context of the defenders and goalkeepers in more detail and assign a more intuitive xG value.
For example, the biggest difference in xG for a single chance for Jota was his tap-in against Southampton in November. After some great work down the right-hand side, Mohamed Salah squares it across the six-yard box to Jota who finds himself with time, space and an open goal to aim at and duly adds another goal to his impressive tally.
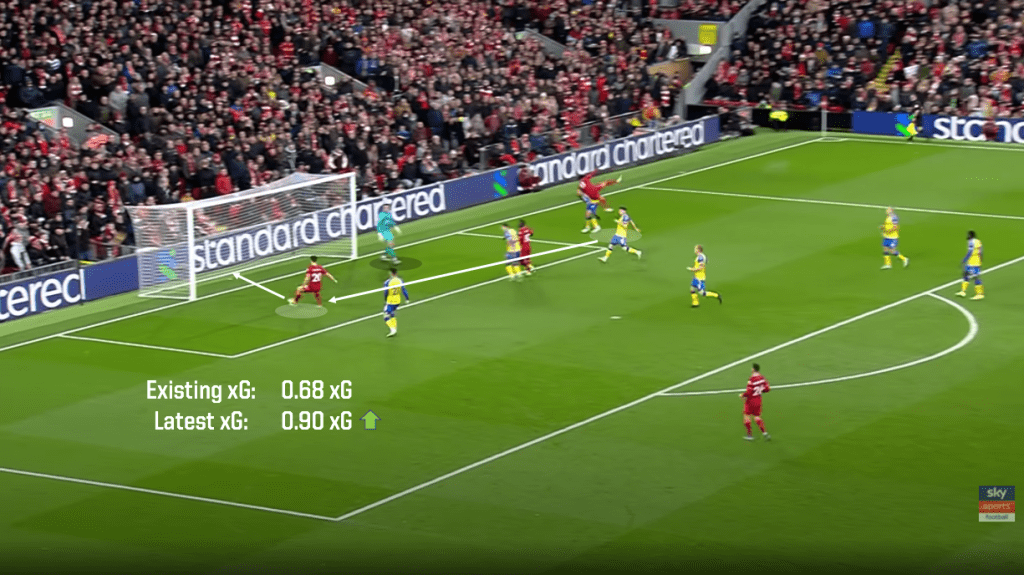
While the existing model already assigns a high xG value of 0.68 for this chance, the latest model gives this a value of 0.90 xG, more reflective of the open goal that he faces.
Jota found himself with time and space for multiple chances that ultimately increased his total season xG but, not all of his chances increased in quality. The same features also give more information on chances that aren’t as easy as they may first appear.
Aston Villa’s Ezri Konza was spared some embarrassment when his under-hit back pass to Emiliano Martínez was smothered by his goalkeeper as an onrushing Jota was able to get a shot away.
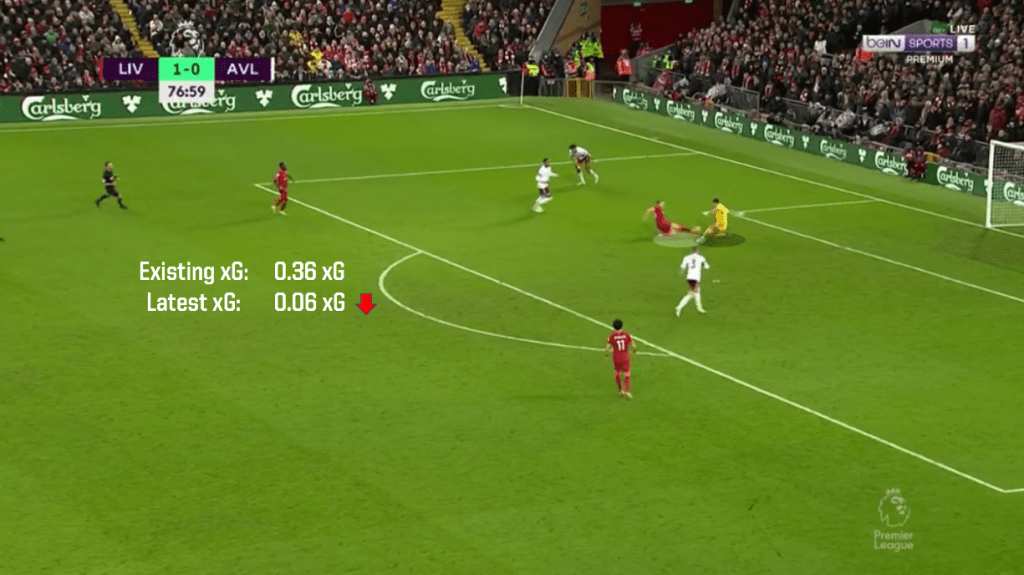
Despite the chance being relatively close to goal, Martínez’s positioning smothers the chance and reduces the visibility to goal. The existing model assigned this chance as 0.36 xG while the latest model gives it a value of 0.06 xG.
Evolving Expected Goals
As technologies and processes in the world of football data change, with the rising availability of tracking data and computer vision capabilities, models will inevitably evolve. However, some things won’t. The concept of expected goals will always remain the same. xG will always give value to the quality of chances. The outputs are just even more informative than ever before.
Enjoy this? Subscribe to our mailing list to receive exclusive weekly content.