
Each of the last three seasons have averaged more goals per game than any across the last 70 years. What gives?
Matchday 21 of the 2021-22 Serie A season was a goal frenzy.
The results from that round of fixtures read:

Thirty-nine goals across 10 games. Only Matchday 14 of the Bundesliga (41 goals) and Matchday 9 of the Premier League (40) produced more goals across a set of fixtures in 2021-22. And of the 10 highest-scoring matchdays across Europe’s big five leagues, five have come from Italy.
Yet, take away the names of the teams above and ask someone to guess what league those fixtures were from and what would they say? The Dutch Eredivisie potentially? A particularly crazy weekend of Premier League games? Or maybe Germany, where the top-heavy imbalance means blowout results like that are always possible.
Chances are it would take them a long time to get to Italy.
The same Italy synonymous with the popularisation of catenaccio – which literally means ‘door bolt’ – a tactic that eschews attacking, progressive football in favour of defensive solidity. The same Italy that saw an average of just over two goals per league game throughout the 1960s, 70s and 80s. The same Italy that has time and time again produced some of the world’s best defenders and is consistently praised by pundits during international tournaments as a side who are the masters of defending.
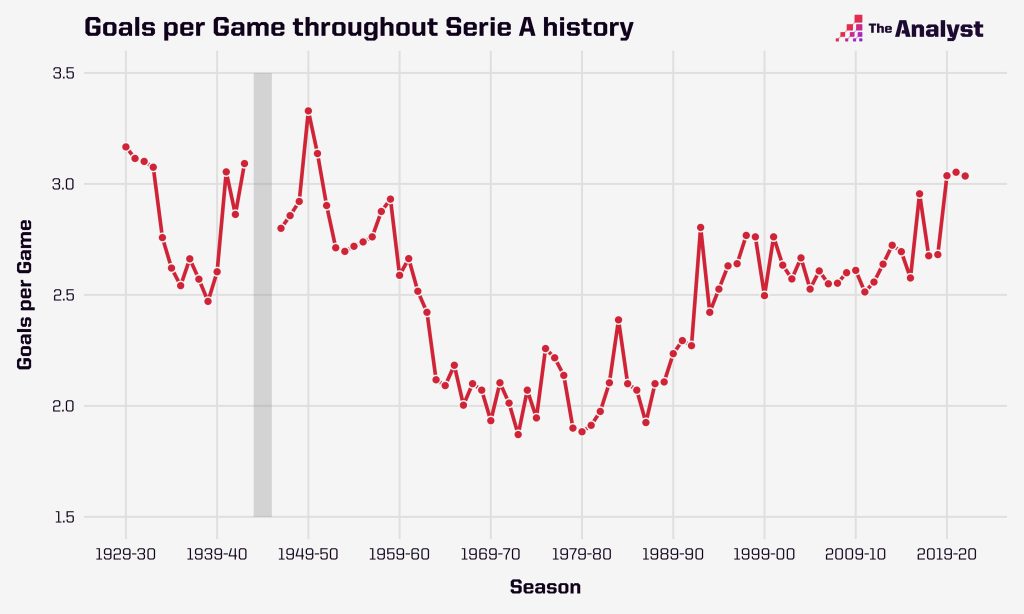
But Serie A is now witnessing goals fly in at an historic rate. The league has averaged over three goals a game in each of the last three seasons. You have to go back 70 years for the last time a Serie A campaign averaged a figure that high.
It begs the question: just what is going on?
First, a quick history lesson. The highest goalscoring season in Serie A history is 1949-50, with 1,265 goals scored across 380 matches for an average of 3.33 goals per game. The top three teams in the league – Juventus (100), Milan (118), and Internazionale (99) – combined to score a ridiculous 25% of those goals alone. As an aside, imagine scoring 118 goals in a single league campaign and not winning it? Brutal.
The following season 1950-51 saw 3.14 goals per game, the third highest in league history, and you’ll be pleased to hear that Milan’s 107 goals were this time enough to see them win the title. But since then, it’s taken close to 70 years to break that three-goal-a-game threshold. That came in 2019-20, where 1,154 goals were scored at an average of 3.04 each match. 2020-21 went six goals better for an average of 3.05 per game, while this season is ticking along nicely, averaging 3.04 per match.
This is a lot higher than Serie A’s historic average of 2.53 a game, and still considerably up on the 2.69 average we’ve witnessed in the 21st century.
It’s a great time to be a striker. But why? Why the historic levels of net-bulging?
Let’s test some theories.
Theory 1: It’s happening everywhere, not just in Italy
While not exactly addressing the underlying causes, this theory might suggest the current goal frenzy is not just limited to Serie A.
A quick tour around Europe tells us this a pretty easy theory to strike off.
At 2.83 goals per game, the current Premier League season is on track to become the most goal friendly of any of its predecessors. But it’s not exactly a massive outlier compared to the 2.66 goals it sees on average across its history, nor is there evidence of the goal tallies trending upward. 2020-21 ranked 12th highest for goals while 2019-20 ranked eighth. Its top five highest-scoring seasons are all from 2010 onwards, yes, but you’ve got 2011-12 and 2012-13 sprinkled in there.
It is categorically not happening in La Liga. The last three seasons have averaged a meagre 2.50 goals per game, and each appear in the top five lowest-scoring seasons in the 21st Century. Funny what happens when you lose two of the most lethal goalscorers in history, huh.
While the last four seasons in the Bundesliga have seen games eclipse three goals a game on average, it’s by far the highest-scoring league of Europe’s big five, averaging 3.07 goals per game over its history. Currently, we’re seeing 3.11 goals a game in Germany, more than Serie A this season, but the key difference is that 24 seasons in Germany have seen an average higher than that, compared to just eight in Italy.
Ligue 1 in 2021-22 is seeing 2.79 goals a game, slightly higher than average but nothing to really write home about. Twenty-eight seasons have seen more goals a game than that.
So, it seems that Serie A is seeing a unique combination of higher goals in absolute terms and also tallies that are statistical outliers vs. previous seasons.
Theory 2: The VAR era is seeing a load more penalties given
When VAR was introduced at the 2018 World Cup, a huge spike in penalties came with it. Twenty-nine to be exact, beating the previous record of 17 at the 1998 tournament. The dramatic increase in the number of penalties awarded during the tournament was clearly a consequence of VAR catching fouls which would otherwise gone unpunished. Are we seeing a similar effect take place in Serie A? Is that where all the goals are coming from?
VAR was introduced in the 2017-18 Serie A season. Since then, we’ve averaged 0.30 penalty goals a game. Before VAR’s introduction, that figure stood at 0.25 a game. So yes, we’ve seen a slight increase. But over the course of a season that increase is only worth about 19 additional goals. It’s contributing, but it’s not exactly a needle-moving total.
What is perhaps more of note is that since the 2017-18 season, 79.2% of penalties taken have been converted. That’s up from the 76.0% conversion rate in the years before that (since 2004-05).
Which brings us nicely to…
Theory 3: Players are converting their shots at a ridiculous rate
Goals and shots seem pretty inextricably related, right? So, let’s drill deeper into the shooting habits of Serie A players.
Let’s start with shot volume. At the risk of stating the blindingly obvious, more shots might mean more goals.
The data does throw up some peculiarities here. The average shots per game in Serie A matches was following a nice downward trajectory before a two-year spike between 2018 and 2020 shot it (literally) back up again. But despite the increase in shots, 2018-19 saw a fairly standard 2.68 goals per game, while 2020-21 and 2021-22 have been historically high scoring as we’ve mentioned, despite historically low shot volumes.
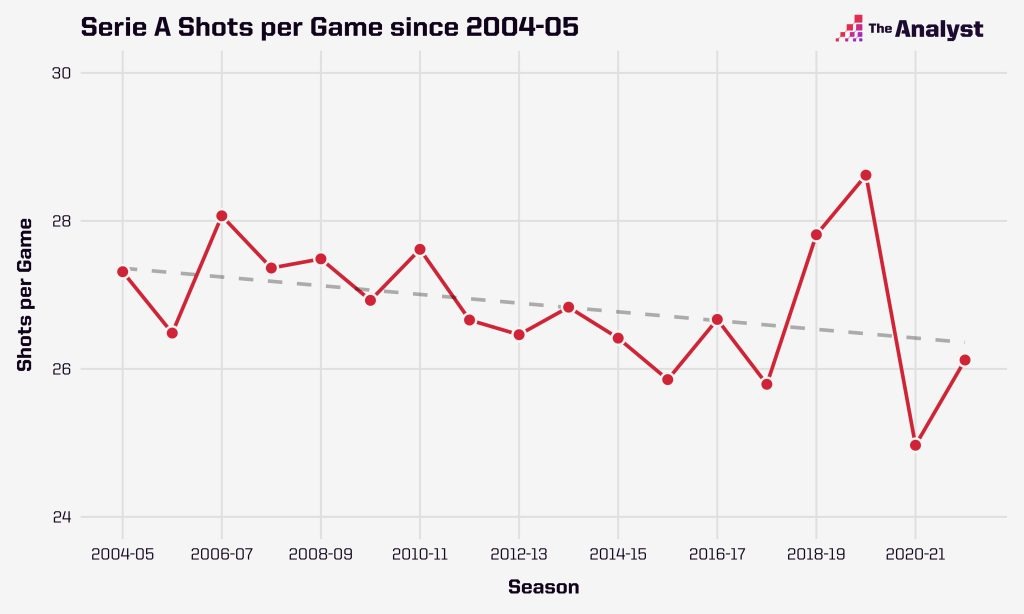
There’s nothing too concrete here yet.
But when we look at the conversion rate of these shots, we start to see a pattern emerge:
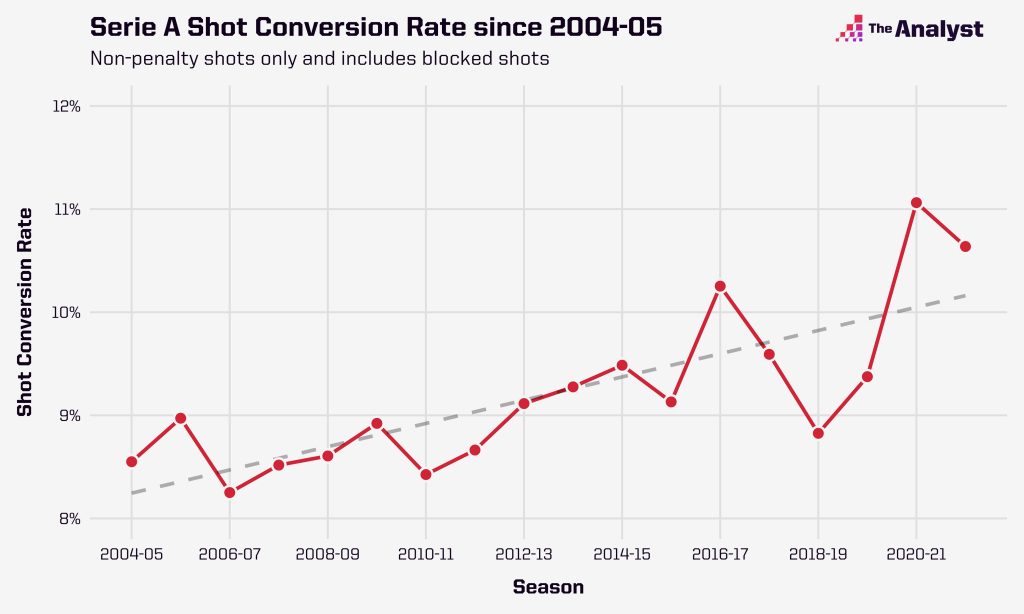
The last three seasons have seen non-penalty shot conversion rates of 10.6%, 12.2% and 11.6%. Those are three of the four highest seasonal rates we have on record.
So, it’s not necessarily that players are taking more shots, but it’s that they’re scoring with more of them. Why?
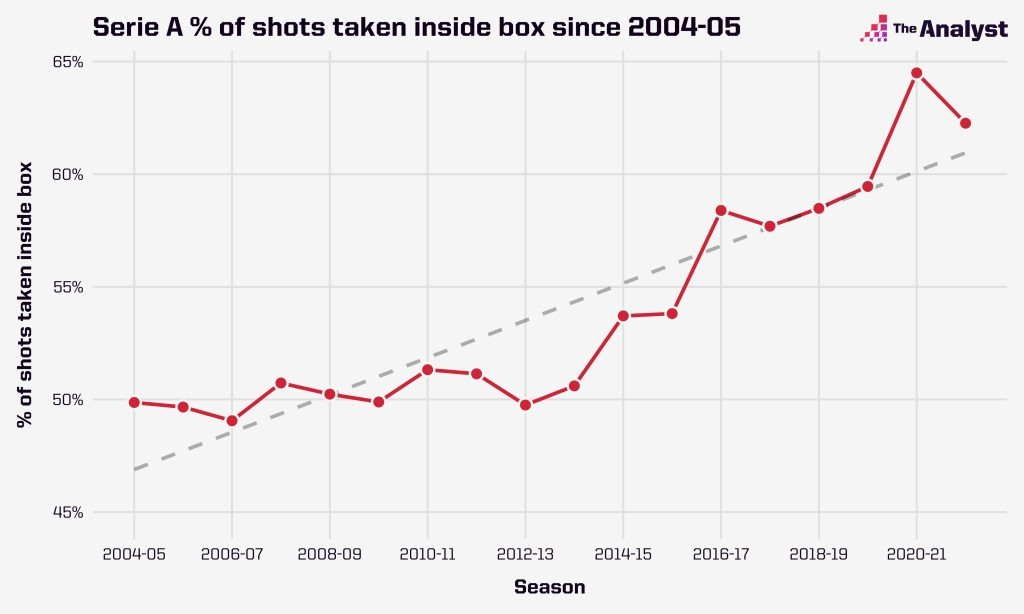
Aside from “players are just getting better” which a) could very well be true but b) is difficult to quantify, a look at shot locations is telling. Since 2004-05, the last three seasons have each seen the highest goals from inside the penalty box per game. Not only that, but the percentage of total shots taken inside the box has continually climbed over the last decade, peaking in the last three years.
And the shooting distance has dropped dramatically as well:
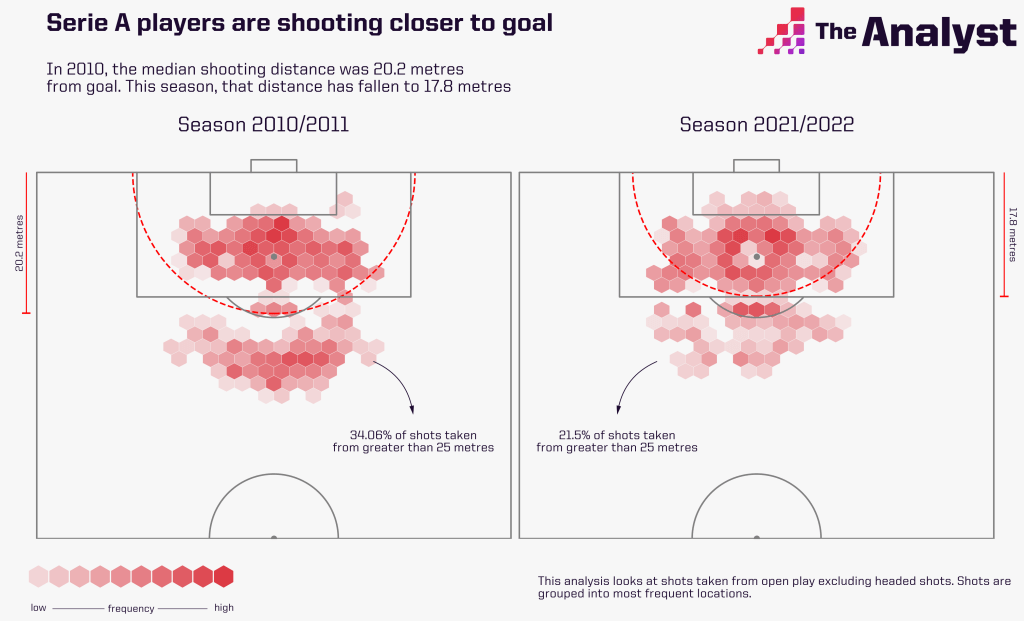
Now we’re getting somewhere. Given this, it must logically follow that …
Theory 4: Players and teams are being influenced (either directly or indirectly) by the concept of expected goals
Fewer shots but from better locations is leading to a higher proportion of those shots going in. Sound familiar? That’s basically following the logic of expected goals, which takes into account a multitude of factors – of which shot location is key – to assign each shot a percentage chance of being scored. Shots closer to the goal (generally) have a higher chance of going in, so working the ball into dangerous areas before shooting is (generally!) a more effective tactic.
And the rising tendency for players to forgo longer-range efforts in favour of closer-range, penalty-box strikes that we saw in Theory 3 is born out in the data.
Expected goals per game has been on a slow, but upward trend over the last decade in Italy and again seems to have peaked in the last three seasons. This has been accompanied by a small but not unimportant rise in the xG/shot of efforts in Serie A, with each of the last three years eclipsing 0.10 xG/shot, compared to just twice in the previous nine seasons prior.
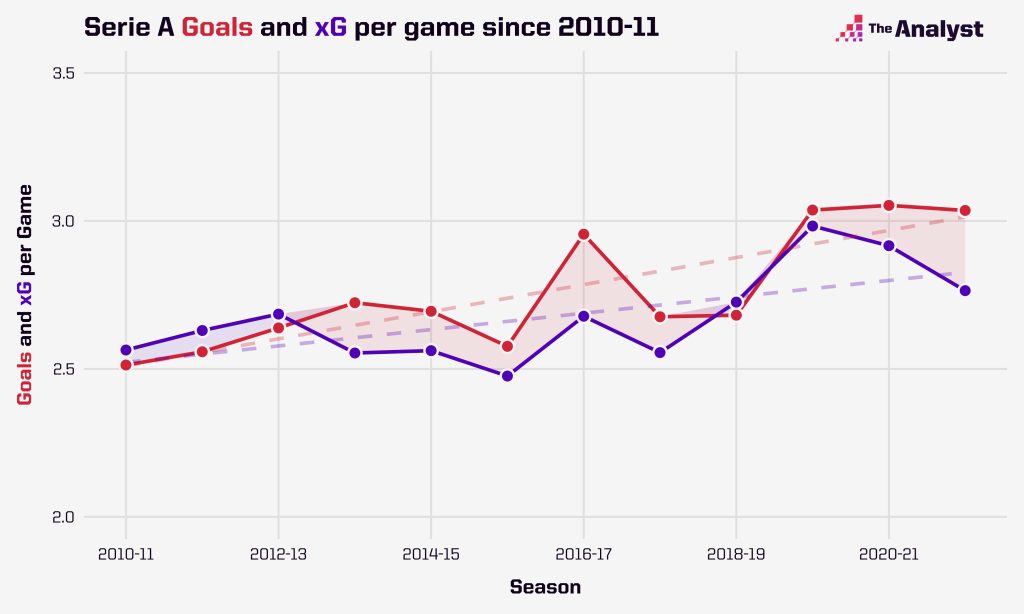
The above graphic, which charts goals per game vs. xG per game, also shows us that the current goalscoring glut is not even really due to players vastly outperforming xG either. We’re just seeing better chances being taken at the business end of the pitch.
Bonus Theory: Poor goalkeeping is helping
Has poor goalkeeping in Italy also contributed to the climb in goals scored?
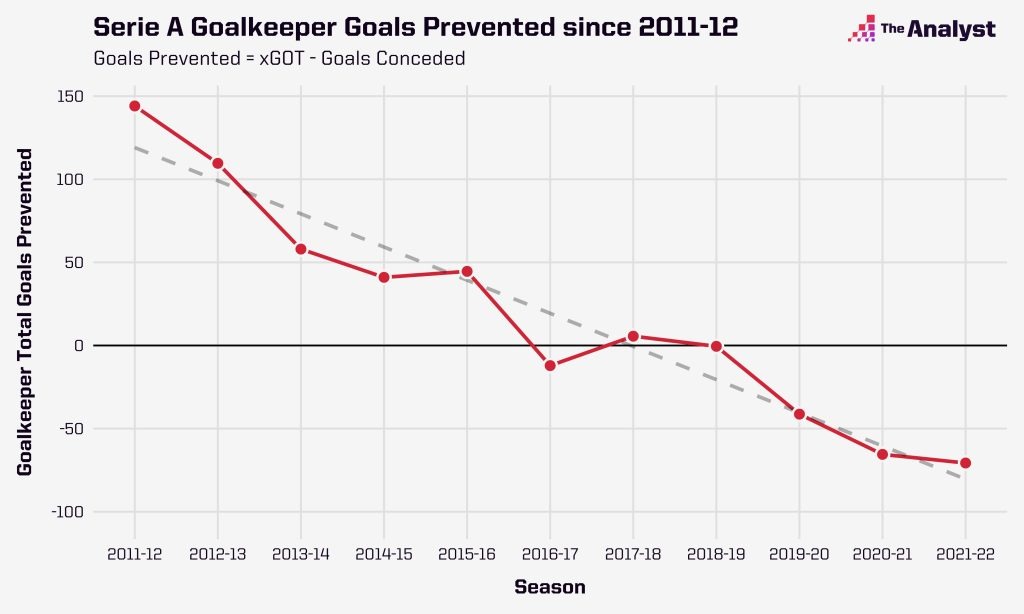
We can use Opta’s expected goals on target (xGOT) model to help us here. This builds on our xG model by telling us what happens after a shot is taken. Two shots from the exact same location on the pitch might have identical xG values, but they will have different likelihoods of going in if one is heading into the top corner and one is hit straight down the middle of the goal. Thus, depending on their location, each shot will have a different xGOT value. And given that xGOT measures the probability of shots on target resulting in goals, the only factor preventing them being scored is the goalkeeper. This means that we can predict how many goals a goalkeeper would be expected to concede, based on the quality of the shots they faced.
So, are we seeing a real dearth in quality of ‘keeping in Serie A? The numbers really suggest so.
According to our xGOT model, goalkeepers in Serie A this season have conspired to collectively concede over 70 goals more than our models suggests they should have. We’re barely 60% of the way through the season and, although there is time for goalkeepers to buck up their ideas, that figure is the highest figure of any Serie A season on record. It wasn’t much better in 2019-20 or 2020-21 either, with -41.3 and -65.5 goals conceded above expectation respectively. In fact, when we trend goals prevented since the start of last decade, we see a pretty clear trend:
It would be disingenuous to look at this and simply say, “goalkeeping has become worse in Serie A.” There are more factors that could be influencing these numbers, not least the fact that goalkeepers are now not purely selected on their shot-shopping pedigree – the ability to play with their feet is equally important. But the evidence does point to a drop in goalkeepers’ ability to make saves. Of the top 20 best individual performances in Serie A since 2010-11 in terms of goals prevented, 15 of them came between 2011-12 and 2013-14. It’s no coincidence that Serie A was home to prime Gianluigi Buffon, Samir Handanovic and Christian Abbiati early in the decade, while Neto was an extremely underrated force in goal for Fiorentina, earning himself a move to Juventus in 2015.
In many ways, the explosion of goals in Serie A captures the sometimes-intangible feeling that analytics are playing an ever-increasing role in the game. Players are shooting less frequently but making sure that they are taking higher-quality shots from closer locations, increasing their likelihood of scoring. And goalkeepers are finding it harder than ever to keep the ball out of the net.
There, a 2,000-word article condensed into a paragraph. Now let’s see if we can fit it into a tweet.