Unfortunately for them, the Chicago White Sox have done it. They have broken the record for the most losses in a season. But does that mean they’re the worst team in MLB history? We’re digging into the data to find out.
They’ve been the subject of punchlines, insults and mind-blowing factoids.
After losing 14 straight games earlier in the season, the Chicago White Sox had to endure an American League-record 21-game losing streak that ended in early August.
They’ve already been labeled the worst team in franchise history. And now, after Friday night’s loss at Detroit, they are team with the most losses in Major League Baseball history.
Chicago has been teetering back-and-forth with the 1916 Philadelphia Athletics for quite a while now as the club still hopes to avoid finishing with the worst winning percentage of the modern era (since 1901).
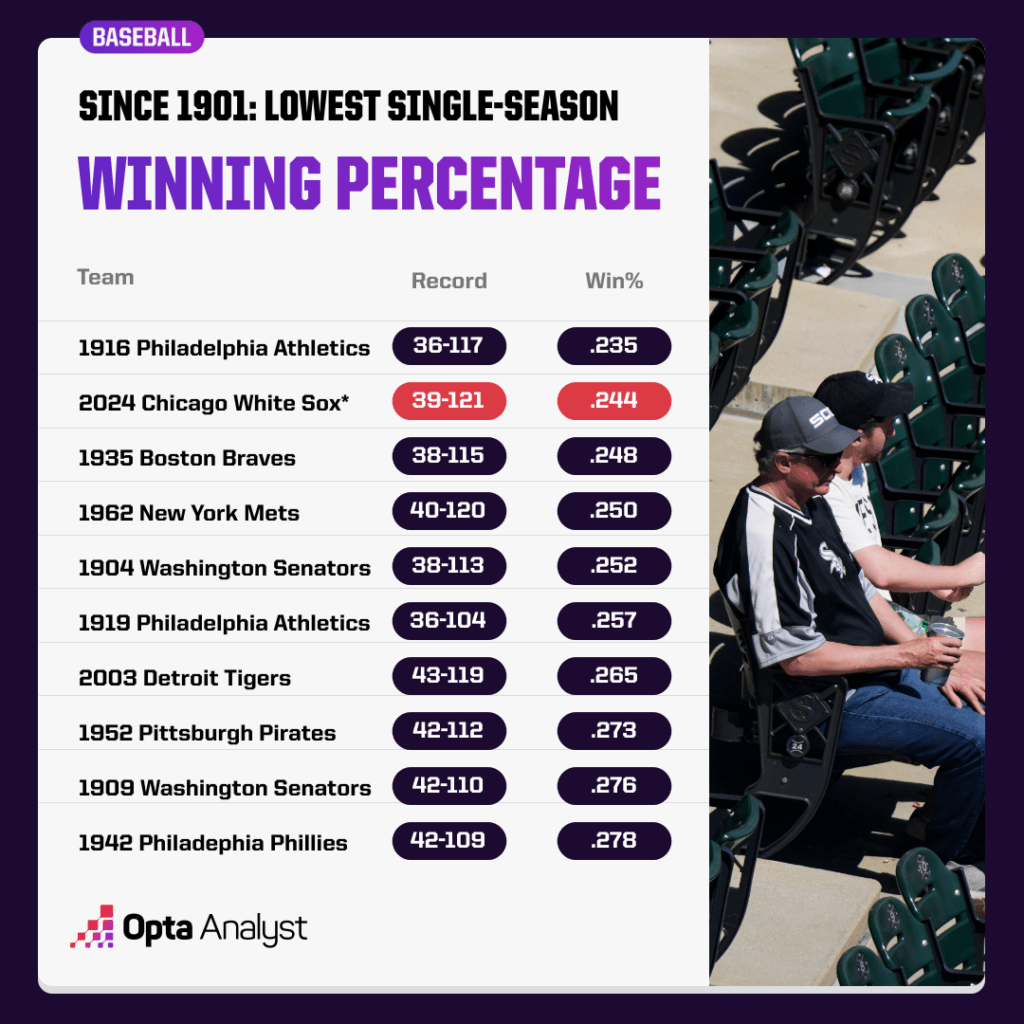
But even if the Sox end up with the lowest winning percentage of all time – or the worst since the Philadelphia Athletics more than 100 years ago – does it really mean they’re the worst team of all time or the second-worst team of all time? Really?
Traditionally, it’d be difficult to say for sure because comparing teams across all different types of eras isn’t quite a 1-for-1 comparison. Each segment of MLB history has its own league environment factors that either inflated or deflated numbers and records during that time.
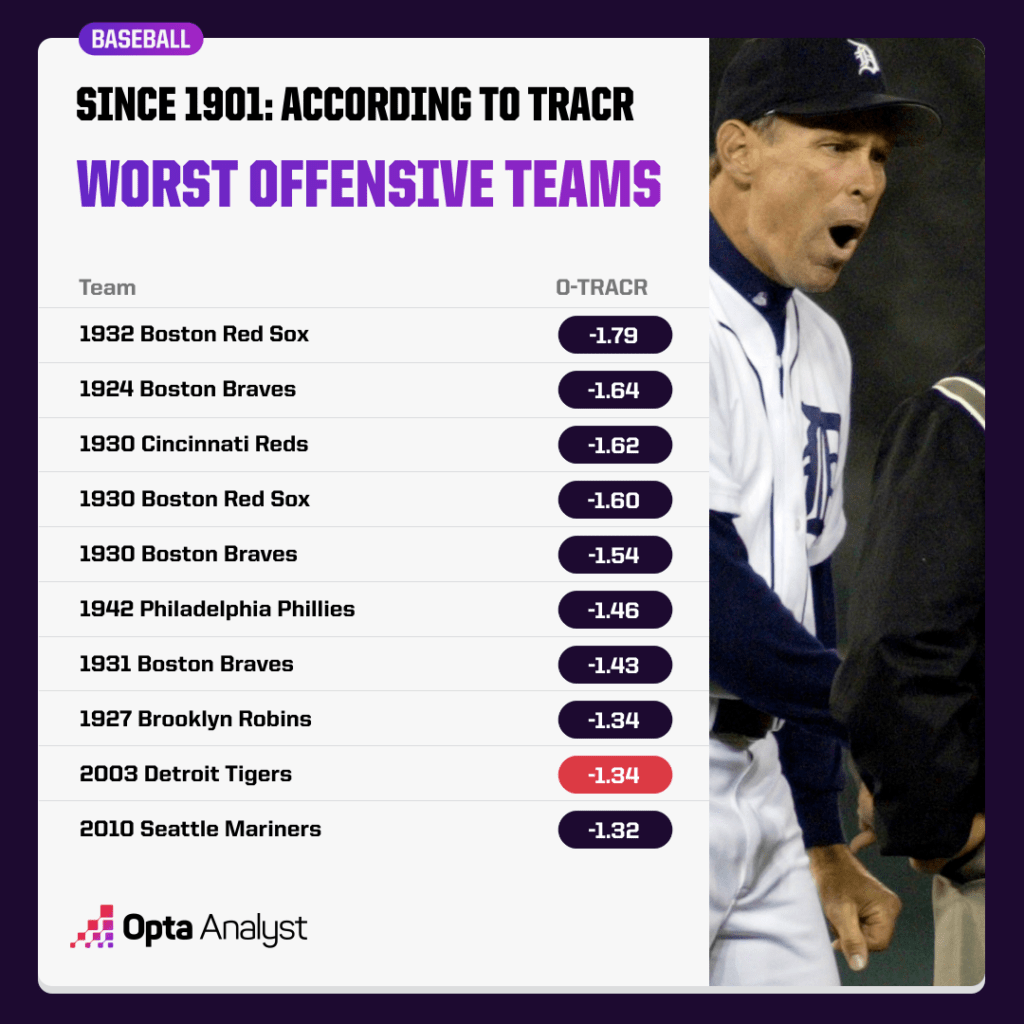
However, our TRACR model can help remove the noise and normalize performance by using advanced metrics and other factors offensively, defensively and on the mound to calculate how many runs per nine innings better or worse teams are or were compared to the league-average club during a season (including the playoffs).
From that output, we’re able to get an offensive TRACR (O-TRACR), defensive TRACR (D-TRACR) – which includes both defensive and pitching staff performance – and an overall TRACR. (Lower is better for D-TRACR.)
So what does our model reveal about where the 2024 White Sox rank among the worst teams in modern MLB history? Believe it or not, they aren’t the worst – and it’s really not even close – despite what you’ve seen with your own eyes this season.
Here’s the list of MLB’s lowest-rated teams since 1901, per model:
1. 1932 Boston Red Sox: 43-111 (-2.57 TRACR)
The 1932 Red Sox may not have finished with the worst winning percentage of all time (they’re tied for 11th), but they easily had the worst offense in modern-era history with a -1.79 O-TRACR. While teams like the New York Yankees and Philadelphia Athletics were each averaging 6.4 runs per game in the American League, Boston managed an MLB-low 3.7. In fact, the team’s run differential per game of -2.3 is the worst of any club since 1901.
2. 1924 Boston Braves: 53-100 (-2.54)
Braves’ hitters struggled mightily in 1924, finishing at the bottom of the National League standings while averaging an MLB-worst 3.4 runs per game. They also posted an abysmal .633 OPS that was far behind the second-worst Chicago Cubs’ mark of .719. And though the league batted a healthy .286 100 years ago, this Braves team managed an MLB-low .256 average.
3. 1915 Philadelphia Athletics: 43-109 (-2.45)
The A’s won six pennants and three World Series titles between 1902-14 before their dynasty was broken up after losing the 1914 Series due mostly to financial concerns (some things haven’t changed all that much). That dismantling resulted in an awful stretch in which the once-proud franchise finished in last place seven years in a row. Philly’s run prevention was historically bad in 1915, putting up the third-most D-TRACR (2.19) of the modern era. Though the Athletics went a franchise-worst 36-117 in 1916, our model rates the 1915 team as a bit worse. That 1916 team sits 12th in our rankings.
4. 1945 Philadelphia Phillies: 46-108 (-2.41)
You’d think a team with Jimmie Foxx and DiMaggio would finish in first place. The only problem was that Foxx was in the final season of his Hall of Fame career and it was Vince DiMaggio manning center field instead of his legendary brother Joe. Philadelphia was bad overall, ranking in the bottom 75 in both O-TRACR (-1.02) and D-TRACR (1.39). The 1903 St. Louis Cardinals (43-94), 11th on this list (-2.28), were the only other team to rank that low in both categories.
5. 2003 Detroit Tigers: 43-119 (-2.40)
It’s probably not a surprise to find this team on the list. The 2003 Tigers are widely considered one of the worst clubs of the modern era – and the data confirms it. Detroit lost its first nine games of the season under manager and former Tigers legend Alan Trammell and were 18-61 on June 29. The Tigers were 80 games under .500 and close to the 1916 Athletics’ .235 win percentage before winning five of their last six.
6. 2019 Detroit Tigers: 47-114 (-2.38)
Not even Ron Gardenhire and Miguel Cabrera could save the Tigers in 2019. Cabrera had been in decline already and hit .282 with 12 home runs in 136 games. Detroit finished last in the majors with 3.61 runs per game and 1,595 strikeouts. The Tigers were also nearly last in batting average (.240) and homers (149) on the way to the 17th-worst offensive performance (-1.30) since 1901, per TRACR.
7. 1936 Philadelphia Athletics: 53-100 (-2.36)
After winning it all in 1929 and 1930, the Athletics dismantled another dynasty in the mid-1930s for financial reasons. That teardown led to 13 consecutive losing seasons. Even though the 1943 and ’46 A’s had worse winning percentages in finishing 49-105 each year, our model says they weren’t as good in 1936 and ’39.
8. 1939 Philadelphia Athletics: 55-97 (-2.31)
Run prevention (pitching and defense) proved to be a major issue during two miserable stretches for the franchise following years of glory. Between 1915-54, the Athletics have seven teams among the bottom 50 of our modern-era D-TRACR rankings.
9. 1954 Philadelphia Athletics: 51-103 (-2.31)
Player-manager Eddie Joost lasted just one season with the A’s after they finished in last place and ended up with the 20th-worst effort in run prevention since 1901, according to our model. It was the last season in the team’s 54-year history in Philly as the franchise moved to Kansas City the next year. They would become the Oakland Athletics just 13 years later.
- 10. 1903 St. Louis Cardinals (-2.28)
- 11. 1916 Philadelphia Athletics (-2.24)
- 12. 1911 Boston Rustlers (-2.24)
- 13. 1905 Brooklyn Superbas (-2.23)
- 14. 1904 Washington Senators (-2.22)
- 15. 1942 Philadelphia Phillies (-2.22)
- 16. 1937 St. Louis Browns (-2.21)
- 17. 1939 St. Louis Browns (-2.21)
- 18. 2023 Oakland Athletics (-2.20)
- 19. 1962 New York Mets (-2.20)
- 20. 1941 Philadelphia Phillies (-2.17)
- 21. 1919 Philadelphia Athletics (-2.16)
- 22. 1939 Philadelphia Phillies (-2.15)
- 23. 1921 Philadelphia Phillies (-2.14)
- 24. 1938 Philadelphia Phillies (-2.14)
- 25. 1928 Philadelphia Phillies (-2.12)
- 26. 1996 Detroit Tigers (-2.10)
- 27. 1909 Washington Senators (-2.06)
- 28. 1955 Kansas City Athletics (-2.05)
- 29. 2002 Detroit Tigers (-2.05)
- 30. 1952 Pittsburgh Pirates (-2.03)
- 31. 1935 Boston Braves (-2.03)
- 32. 1925 Boston Red Sox (-2.02)
- 33. 2004 Arizona Diamondbacks (-2.02)
- 34. 1949 Washington Senators (-2.01)
- 35. 2010 Pittsburgh Pirates (-2.00)
- 36. 1954 Pittsburgh Pirates (-2.00)
- 37. 2024 Colorado Rockies (-1.98)
- 38. 1901 Cincinnati Reds (-1.97)
39. 2024 Chicago White Sox: 39-121 (-1.95)
Things didn’t get any better once Chicago shipped out outfielders Tommy Pham and Eloy Jimenez, infielder Paul DeJong, and pitchers Michael Kopech, Tanner Banks and Erick Fedde ahead of the MLB trade deadline. Ace Garrett Crochet remained with the club, but the Sox put him on an innings limit down the stretch.
It’s one thing to have a rebuilding season, it’s another to set records for futility. The White Sox were able to stave off history with a rare three-game winning streak in late September, but the record for most losses in a season finally fell in a 4-1 loss at Detroit on Sept. 27.
Perhaps it’s some consolation for the White Sox and their fans that they may hold the record for losses, but they aren’t really that close to being the worst team of all time.
Or perhaps not.
Be sure to check out our MLB, NBA, NFL, college football and golf coverage. And follow us on X and Instagram for more!