We’ve charted and calculated 1-on-1 matchup win percentages for line play and used that data to create college football ELO ratings that are adjusted based strength of competition.
Quantifying pass rush and pass protection production in the public eye has come a long way in the era of football data.
Teams and scouts have always had their own grading systems, but ways to discuss performance in the media or amongst friends wasn’t always possible. In the pre-data times, sacks were ubiquitously used as a pass rush measurement for defenders and there was nothing at all for offensive linemen.
Sacks are a great result for the defense, but they’re not necessarily indicative of future performance. A play results in a sack around 3.8% of the time, or about 2.5 times per game for each team. That jumps to 6.4% on designed passing plays, but that’s still a lot of room for noise in the data.
The second iteration of description of performance was pressures. Pressures occur on around 35% of passing plays, which increased the sample size of data five-fold. There’s a strong relationship between generating pressure and generating sacks, and pressure rates tend to be more predictive of future pressures than sack rate is of future sacks.
This is not to say that sacks are a total crapshoot. Finishing a play with a sack is absolutely a skill, and players like T.J. Watt have truly honed that skill into double digit sacks season over season in the NFL.
Where the analytics largely live now is, rightfully, in rate stats. Pressures per snap or pressures per pass rush introduce an “opportunity” count into the evaluation. We are measuring “success” against “opportunity” rather than relying only on a total count of “success”.
This is important because it standardizes the metrics across all players, and accounts for things a player cannot control. Players miss games and offenses game plan around top pass rushers to ensure their opportunities are limited, so why should we use counting stats to compare a player who had 40 opportunities in a game to a player who had 20?
Counting stats can be great for explaining what happened in a season, but if we’re looking at evaluating a player’s skill level, it is not always the best way.
We’ve charted and calculated 1-on-1 matchup win percentages for line play and used that data to create an ELO rating that’s adjusted based strength of competition. Let’s get into how that works and what makes it a difference maker in performance up front.
Data that Reflects “Successes” and “Opportunities”
To create a good rate stat you need to identify a success and measure it against an opportunity. For pass rushing, there are several ways to view “success.” ESPN’s Pass Rush Win Rate (PRWR) metric identifies success as getting inside a certain distance from the quarterback. Other metrics simply use “generated a pressure” as a success.
These are good metrics, and they certainly tell a story, but we don’t feel like they truly describe a player’s ability to pass rush or pass protect. For instance PRWR describes a good pass rusher as a defender who can consistently get close to the QB, but does that actually describe a player who is a dangerous pass rusher?
A free rush on the QB is considered success, getting close when the QB shuffles away from his launch point is considered success, and getting snatched and buried by an offensive tackle is considered success if you get pancaked too close to the QB. PRWR also assumes that all players have the same opportunity to get close to the QB on every play. A player who is double-teamed does not have the same opportunity as a player who has a free rush.
So what is our solution to the problem? Enter 1-on-1 pass rush matchups. We view a good pass rusher as a defender who can win against his blocker. We view a good pass blocker the same way, though inverted. Whether you are tasked with getting to the quarterback or making sure no one gets to the quarterback, can you succeed in those opportunities?
We identify an opportunity as a situation in which there is a distinct 1-on-1 matchup between a pass rusher and pass blocker. No chip help, no double-teams, no RPOs, no blown assignments and no hard play action. We’re only considering plays in which the ball is in the quarterback’s hand long enough for the matchup to complete.
Why? We’re trying to replicate the 1-on-1s you see at the senior bowl in which both players are aware of their exact job and there is enough time for that job to conclude.
We would also like to say there are ABSOLUTELY more factors to being a good pass protector than performance in 1-on-1s. Offensive linemen in pass protection are essentially playing defense, and cohesiveness and understanding what you can and cannot do are crucial parts of pass protection. However we can only measure what we can measure, and attempting to identify who is at fault if a defender comes free can get hairy real fast.
A defensive “success” is defined, in short, as beating your offensive blocker to the quarterback’s launch point. Remember that offensive linemen cannot see the QB – they’re relying on the QB to be where he is supposed to be (the launch point). If the QB shuffles around too much and compromises the launch point, the defender gets an immediate advantage because he is now trying to win to a different location than the offensive player is trying to defend. Like if a hockey goalie is defending the net on a penalty shot, but the net decides to jump a few feet to the right – not super fair for the goalie. This isn’t the only consideration for “success,” but we’d be here all day if we were to explain every gritty detail.
In college football, there are around 38 1-on-1s per game. It varies heavily by team and scheme, with the top programs averaging around 55 per game and the bottom schools averaging around 25. The average success rate for a defender in college football is 29.7% and 32.3% in the NFL.
But here’s where we really start to see the value in how we measure opportunities: In ESPN’s PRWR there were three NFL players who had a win rate over 25%. Only one had a “win rate” above the average 1-on-1 win rate. The top pass rushers in the 2023 college season had win rates north of 65%.
When comparing 1-on-1 win rate to other win rate metrics, we’re not saying that ours is better simply because defenders win more. We think it’s better because the differences in the least productive and most productive players are so much starker. It is much easier to highlight players who are extraordinary when there is such a clear difference in their numbers relative to the average player.
Adjusting for Strength of Competition
Now that we have data and a metric that properly details a specific football skill, we can look for ways to improve it. In the college game, comparing stats from players across different teams can be a challenge. Schedules are hugely imbalanced, and it’s not practical to compare the stats of a Conference USA player to a SEC player. Our goal was to create a system that uses 1-on-1 matchup data and adjust for strength of competition by using an ELO model.
ELO was created as a way to rank chess players. Each player comes into a match with an ELO rating, and the model creates an expected outcome for the game. Two players with the same rating will each be projected to win 50% of the time. If you win a matchup you were predicted to lose 75% of the time, you see a higher post-match jump than if you win an even match. At its core, it measures how you perform relative to how you are supposed to perform. This is important because it considers who you are playing.
In the 1-on-1 pass rush setting, an ELO system properly rewards win against other good players, while not over-rewarding wins against inferior competition. Take Houston’s Patrick Paul and Washington’s Troy Fautanu as examples of this. Paul won 94.1% of his 1-on-1s while Fautanu won 81.5%.
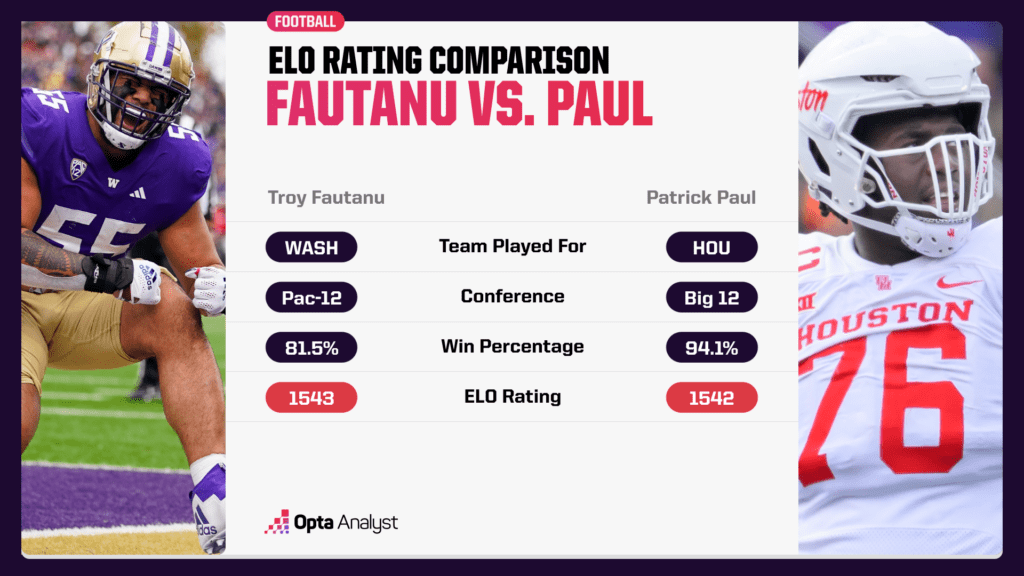
If we only look at the rates, we might assume that Paul is the better pass protector. The problem is Washington played Oregon twice and then Texas and Michigan in the College Football Playoff, all teams with very good pass rushing, while Houston played a Big 12 schedule with only a few games against top-tier teams.
After the ELO model is applied, Fautanu actually comes out with a higher score than Paul. Both were among the top pass blockers in college football in 2023, but ELO highlights what your performance has to look like against poor competition in order to compare to performance against top-level competition.
Some player-level examples from the 2023 season:
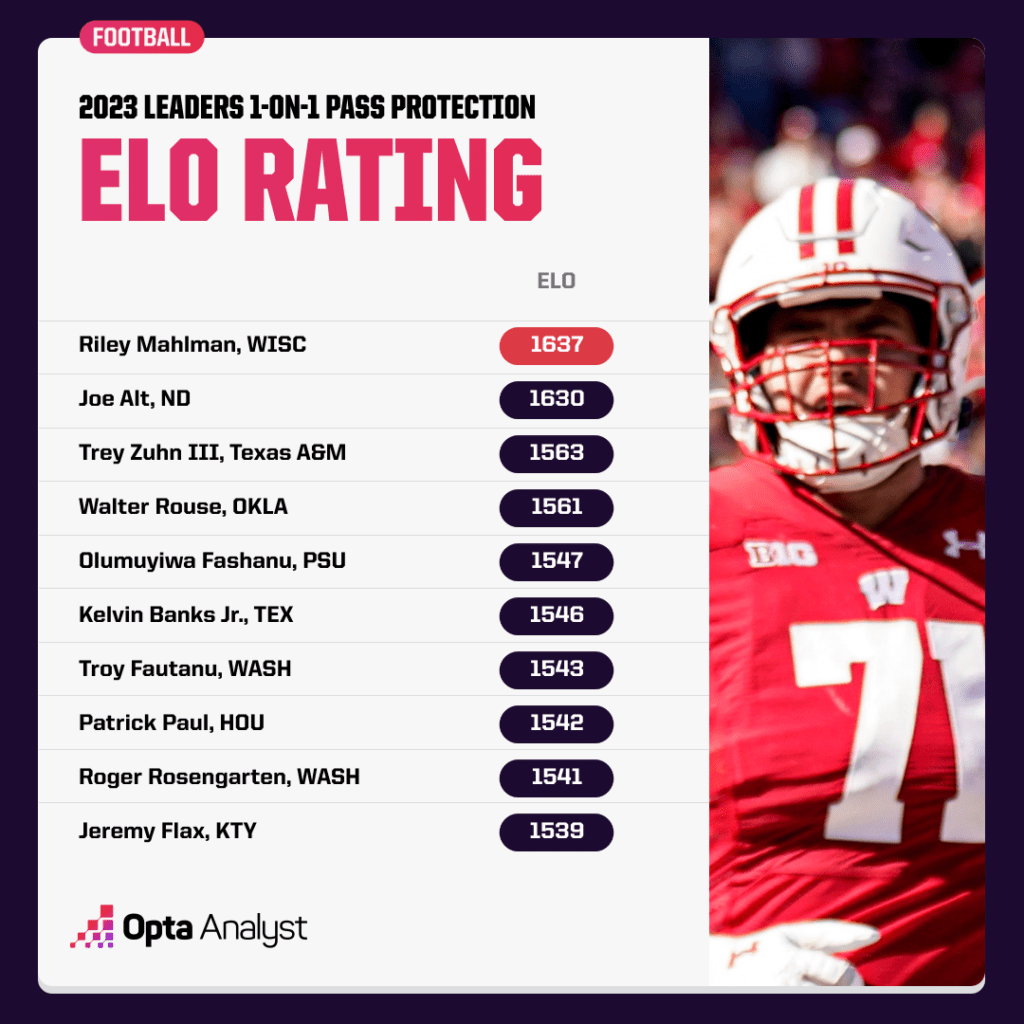
The 2023 College Football Leaders
- Wisconsin’s Riley Mahlman and Notre Dame’s Joe Alt are in a tier of their own at the top. Both had 1-on-1 win rates above 93% and played a tough schedule.
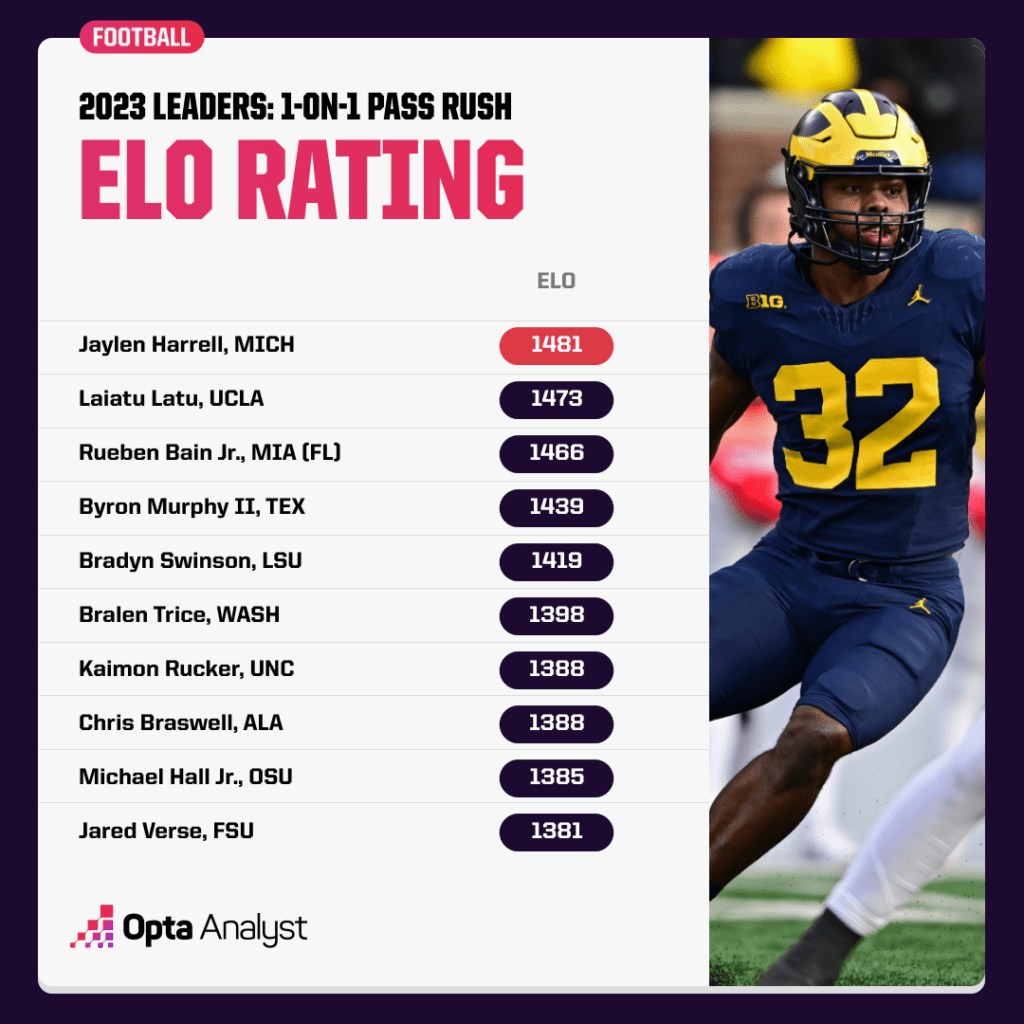
- True freshman Rueben Bain of Miami was already among the best pass rushers in college football in 2023.
Position-Level Examples:
- Offensive tackles were tasked with 1-on-1 pass blocking more than twice as often as interior players. Tackles each had about 31.5% of their team’s total 1-on-1s, guards were around 14%, and centers 8%.
- Defensively, edge rushers had 56% of the 1-on-1s, interior defensive linemen had 34%, and inside linebackers had 8%.
Team-Level Examples:
- Wisconsin had the highest pass blocking ELO, but the fourth lowest pass rushing ELO.
- New head coach Jonathan Smith had his work cut out for him at Michigan State. The Spartans were third to last in pass blocking ELO and sixth to last in pass rushing ELO.
- Of the playoff teams, only Michigan finished outside of the top 10 in pass blocking ELO.
- Alabama and Washington were the only teams to be in the top 10 in both pass rush and pass pro ELO.
Enjoy this? Check out our MLB, NBA and NFL coverage, and follow along on X and Instagram for more.